
- Title
-
Multiple roles of the furrow deepening Ca2+ transient during cytokinesis in zebrafish embryos
- Authors
- Li, W.M., Webb, S.E., Chan, C.M., and Miller, A.L.
- Source
- Full text @ Dev. Biol.
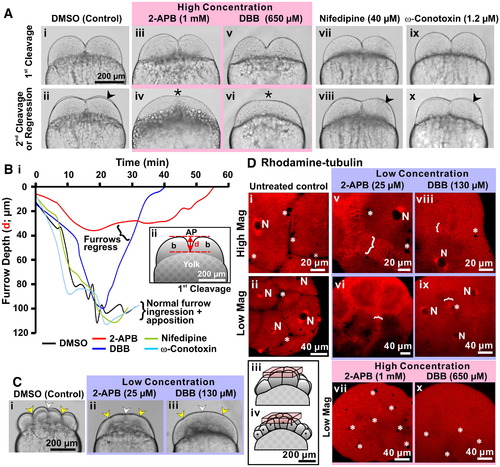
An elevation in [Ca2+]i is required for furrow deepening and maintenance. (A) Embryos were treated after furrow positioning of the 1st cleavage with the IP3R antagonist, 2-APB, with the L- and N-type voltage gated Ca2+ channel blockers, nifedipine and ω-conotoxin, respectively, or with the Ca2+ chelator, DBB at the concentrations indicated. Brightfield images were acquired during deepening of the 1st cleavage furrow and at the time of the appearance of the 2nd cleavage furrow (indicated by arrowheads in panels Aii, Aviii and Ax) or during regression of the 1st furrow (indicated by asterisks in panels Aiv and Avi). (B) Panel Bi shows a time-course of 1st cleavage furrow depth (distance measured is shown in panel Bii) during normal deepening and apposition in DMSO-control, nifedipine- and ω-conotoxin-treated embryos, as well as during abnormal deepening followed by furrow regression in 2-APB and DBB-treated embryos. (C) Brightfield images of three representative embryos that were treated with DMSO (control; panel Ci) or with low concentrations of 2-APB (panel Cii) or DBB (panel Ciii), which were acquired when the control embryo was undergoing deepening of the 3rd cleavage. Indentations in the blastoderm surface indicate the positioning of the 1st (white arrowheads) and 3rd cleavage furrows (yellow arrowheads) in both DMSO control and drug-treated embryos (see panels Ci to Ciii). (D) Embryos injected with rhodamine–tubulin and then either left untreated (panels Di and Dii) or else treated with a low concentration of 2-APB (25 μM; panels Dv and Dvi) or DBB (130 μM; panels Dviii and Dix), or a high concentration of 2-APB (1 mM; panel Dvii) or DBB (650 μM; panel Dx). Microtubules were visualized in all the embryos when the untreated control embryos reached the 8- to 16-cell stage. White brackets denote the furrow microtubule arrays (FMAs), while N denotes nuclei and * indicates yolk platelets; both of which take the form of unlabeled voids of a large and small dimension, respectively. The schematics (see panels Diii and Div) indicate the location within the untreated control 8- and 16-cell stage embryos of the stack of 2-D confocal sections used to reconstruct the images shown in the D panels. |
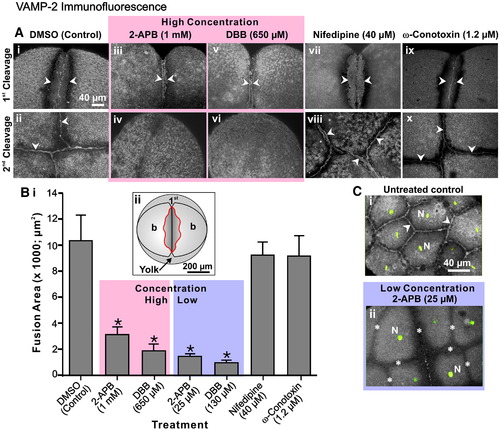
VAMP-2 vesicle fusion requires an elevation in Ca2+ derived from intracellular stores. (A) Embryos were treated after furrow initiation with 2-APB, DBB, nifedipine or ω-conotoxin at the concentrations indicated. They were then fixed during late deepening of the 1st cleavage (see panels Ai, Aiii, Av, Avii and Aix) and at the completion of the 2nd cleavage or 1st furrow regression (see panels Aii, Aiv, Avi, Aviii and Ax) for VAMP-2 immunofluorescence analysis. The regions of VAMP-2 labeling are indicated with arrowheads. Panels Aii, Aviii and Ax indicate the extent of VAMP-2 labeling at the completion of 2nd furrow apposition, whereas panels Aiv and Avi clearly indicate the complete regression of the 1st cleavage furrow and the absence of VAMP-2 labeling in this region in embryos treated with either 2-APB (i.e., 1 mM) or DBB (i.e., 650 μM). (B) The extent of VAMP-2 vesicle fusion during late furrow deepening was quantified at the furrow region by measuring the area of VAMP-2 membrane labeling, indicated in the region within the red line in the schematic shown in panel Bii. Data presented are averaged values ± S.E.M. where n ≥ 6. One-way ANOVA was performed for statistical analysis. The Neuman–Keuls multiple comparison test was performed as a post-hoc analysis. * indicates values significantly different from the DMSO control (at p < 0.001). (C) Untreated control and 2-APB-treated embryos were fixed at the 8- to 16-cell stages for VAMP-2 immunofluorescence (grey-scale). The nuclei (N) were stained with Sytox green (indicated in green). Panels Ci and Cii are 2-D reconstructions from stacks of images captured from an animal pole view. In panel Ci, arrowheads indicate normal VAMP-2 labeling between the fully apposed daughter cells in a control embryo, while in panel Cii the asterisks indicate cleavage furrows in the 2-APB-treated embryos that failed to deepen. |
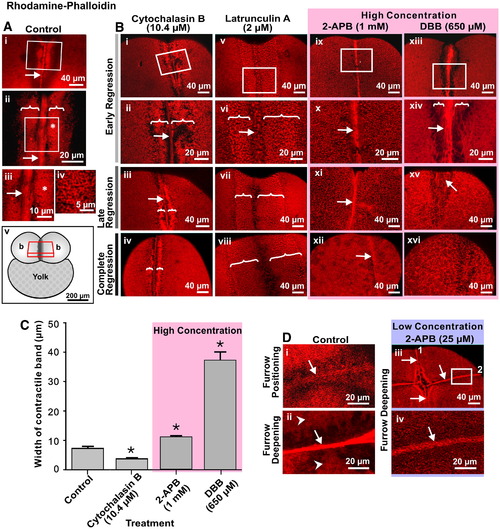
Intracellular Ca2+ is required for actin remodeling during cytokinesis. Representative top views of fixed embryos labeled with rhodamine–phalloidin that were (A) untreated (control) or (B) treated with 10.4 μM cytochalasin B; 2 μM Latrunculin A; 1 mM 2-APB or 650 μM DBB. In the case of the control (A), images are shown in the region of the first cleavage furrow during late deepening. Panels Aii and Aiii are magnified views of the white boxes marked on panels Ai and Aii, respectively. Panel iv is a magnified view of the region shown with an asterisk in panel Aiii. White arrows and brackets indicate the contractile band and the PAEs, respectively. The schematic (panel Av) indicates the location within the embryo of the stack of 2-D image sections used to reconstruct the images shown in A and B. (B) In the case of the various drug treatments, images were acquired during early regression (panels i, ii, v, vi, ix, x, xiii and xiv), late regression (panels iii, vii, xi and xv) and on complete regression (panels iv, viii, xii and xiv). Panels ii, vi, x and xiv are magnified views of the white boxes marked on panels i, v, ix and xiii, respectively. Again, the white arrows and brackets indicate the contractile bands and the PAEs, respectively. (C) Measurement of the contractile band width in cytochalasin B, 2-APB and DBB-treated embryos during early furrow regression. Treatment with cytochalasin B had a significant effect on reducing the width of the contractile band compared to the control, whereas 2-APB and to a much greater degree, DBB, had the opposite effect and significantly increased the width of the band. Data presented are averaged values ± S.E.M. with n = 3 to 5. * indicates values of contractile band width that are significantly different from the control (at p < 0.05 for the CB- and 2-APB-treated embryos, and p < 0.001 for the DBB-treated embryos). (D) Actin remodeling defects in embryos treated with a low concentration of 2-APB. Representative top views of fixed embryos labeled with rhodamine–phalloidin during: furrow positioning (panel i) and furrow deepening (panel ii) of the second cleavage in untreated (control) embryos; and at the end of the second cleavage (panels iii and iv) following treatment with 25 μM 2-APB shortly after the appearance of the first cleavage furrow. Panel iv is a magnified view of the white box in panel iii. In panels i and ii, the arrows indicate the actin rafts and compact contractile band, respectively, which occur during normal cleavage, while the arrowheads in panel ii indicate the PAEs on either side of the contractile band. In panels iii and iv, the numbers (1 and 2) indicate the first and second cleavage furrows, while the arrows indicate the abnormal contractile bands that are visible in the blastoderm cortex following low-concentration 2-APB treatment. |
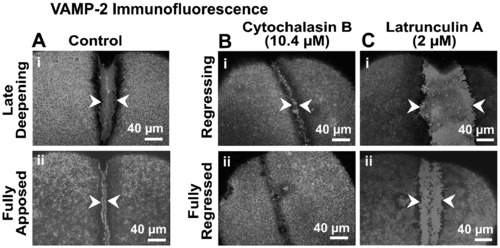
Effects of cytochalasin B and latrunculin A on VAMP-2 immunofluorescence. Panel A illustrates the extent of VAMP-2 immunofluorescence labeling of the furrow region in representative control embryos during late deepening and full apposition (see arrowheads in panels Ai and Aii, respectively). Panels B (i and ii) and C (i and ii) show VAMP-2 labeling (see arrowheads) in embryos treated with 10.4 μM cytochalasin B and 2 μM latrunculin A, respectively, at equivalent time periods as the controls. In both these cases the cleavage furrows are either in the process of regressing (see panels Bi and Ci) or are fully regressed (see panels Bii and Cii). |
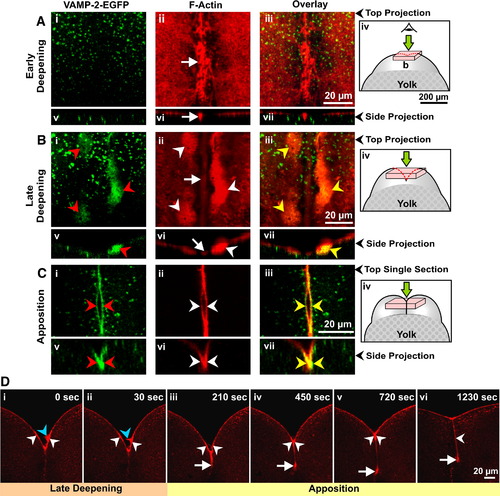
VAMP-2-EGFP labeling and actin remodeling during furrow deepening and apposition. (A to C) Embryos were fixed during (A) early and (B) late deepening, as well as during (C) apposition of the 1st cell division to monitor the redistribution of VAMP-2-EGFP labeling (green; panels i and v), F-actin remodeling (red; panels ii and vi), and any potential co-localization between the two (panels iii and vii). Panels Ai to Aiii and Bi to Biii are stacks of confocal sections that have been projected as a single image, while panels Ci to Ciii are single optical sections taken from image stacks as these showed the labeling more clearly. Panels Av to Avii, Bv to Bvii and Cv to Cvii represent side projections in the x–z plane of the corresponding x–y plane stack projections. Red, white and yellow arrowheads indicate VAMP-2-EGFP labeling of the furrow membrane, the PAEs and the overlap between the two, respectively, while the white arrows indicate the contractile band. Panels Aiv, Biv and Civ illustrate schematics of embryos to show where the optical stacks (used to construct the images shown in panels A and B) or single sections (used for the top projection images shown in panels Ci to Ciii) were obtained from within the dividing embryo. (D) Time-series of single confocal sections showing the dynamics of actin remodeling in a representative embryo undergoing 1st cleavage, imaged from a facial view. Images are of live embryos injected with low concentrations of rhodamine–phalloidin. The contractile band and PAEs are indicated by white arrows and arrowheads, respectively, while the finger-like projections that extend from the PAEs are indicated by blue arrowheads. |
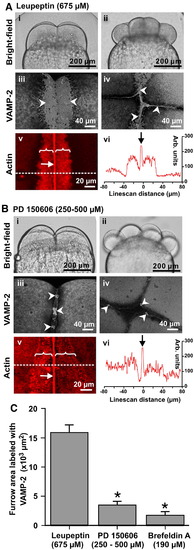
VAMP-2 vesicle fusion and PAE formation is inhibited by the calpain inhibitor, PD 150606. Embryos were treated with either the general protease inhibitor, leupeptin (675 μM) as a control (see panel A) or the calpain inhibitor, PD 150606 (at 250 to 500 μM; panel B). Brightfield images were captured at the beginning of the second cleavage (panels Ai and Bi) and completion of the third cleavage (panels Aii and Bii). Selected embryos were fixed for either VAMP-2 immunolabeling during the first cleavage (see panels Aiii and Biii), and at the completion of the second cleavage (see panels Aiv and Biv), or for F-actin labeling using rhodamine–phalloidin during the first cleavage (see panels Av and Bv). VAMP-2 labeling is indicated by white arrowheads, while the contractile bands and PAEs are indicated by white arrows and brackets, respectively. Panels Avi and Bvi are actin staining intensity line-scans (taken at the positions indicated by the dashed lines in panels Av and Bv). Panels Aiii to Av and Biii to Bv are 2-D images reconstructed from stacks of images captured from an animal pole view. (C) The degree of VAMP-2 vesicle fusion was quantified during late deepening of the 1st cleavage and presented as averaged fusion area ± S.E.M. (n ≥ 5 for each treatment). One-way ANOVA was performed for statistical analysis. The Neuman–Keuls multiple comparison test was performed as a post-hoc analysis. * indicates significant differences compared to the leupeptin-treated controls (at p < 0.001). Embryos treated with brefeldin A (190 μM), an inhibitor of membrane trafficking from the Golgi, were included as a control for the inhibition of vesicle fusion. |
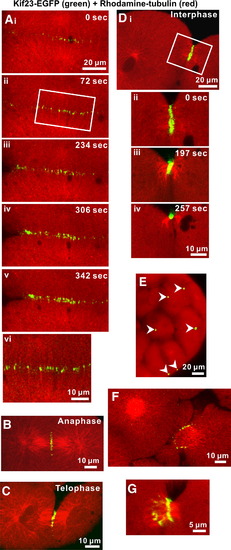
Enhanced-GFP kinesin-like protein (kif23-EGFP) localization during cytokinesis in zebrafish embryos. Kif23-EGFP is indicated in green and rhodamine–tubulin labeling is in red. Panels Ai to Av illustrate a time-series of kif23-EGFP recruitment to the cleavage furrow during deepening of the 3rd cell division cycle. Panel Avi shows a magnified view of the region indicated with a white box in panel Aii, which suggests that kif23-EGFP is colocalized with microtubules. Kif23-EGFP recruitment to the future cleavage plane begins at anaphase (see panel B) and lasts through telophase (see panel C) and interphase (see panel D), at which time the furrow undergoes apposition. During interphase, microtubule bundling is temporally and spatially associated with the convergence of kif23-EGFP fluorescence into a spot, which is located between adjacent daughter cells. This process is illustrated in a time-series (see panels Dii to Div) taken from the area indicated by the white box shown in panel Di. During the late Cleavage Period of zebrafish development, many kif23-EGFP spots can be seen between daughter cells (see white arrowheads in panel E). Panels F and G illustrate the ring-like localization of kif23-EGFP surrounding the microtubule bundle that still connects daughter cells during the late stage of cytokinesis. The ring-like structure eventually constricts leaving a characteristic single kif23-EGFP spot between daughter cells, as illustrated in panel Div. |

Recruitment of VAMP-2 vesicles to the cleavage furrow requires kif23. Transient expression of kif23-EGFP (green) and VAMP-2-HT (red) in live embryos. (A) Time-series showing the temporal and spatial relationship between the recruitment of both kif23-EGFP and VAMP-2 to the furrow region in a representative zebrafish embryo undergoing cleavage at the 64- to 128-cell stage. The recruitment of kif23-EGFP to the cleavage furrow plane is indicated by yellow arrowheads (see panels Aii to Av) while the appearance of VAMP-2 labeling in the new furrow membrane is indicated by white arrowheads (see panels Aiv and Av). (B and C) Embryos were injected at the single cell stage with mRNA encoding either functional kif23-EGFP or a dominant-negative form of kif23 (kif23-trnc-EGFP), and were then fixed at the 8-cell stage for subsequent VAMP-2 immunofluorescence analysis. Panel Bi clearly indicates that kif23-EGFP is recruited to the cleavage furrow during the onset of furrow deepening (see yellow arrowhead in panel Bi and yellow bracket in panel Bi′). This coincides with the recruitment of VAMP-2 vesicles, which are concentrated at the furrow as shown in panel Bii (see white arrowheads in panels Bii and Bii′). Panel Biii indicates a normal blastoderm with mononucleate cells and characteristic kif23-EGFP spots between daughter cells that have successfully completed cytokinesis. Panel Ci on the other hand clearly shows that kif23-trnc-EGFP fails to be recruited to the cleavage furrow during furrow deepening and has a dominant-negative effect on VAMP-2 vesicle recruitment to the deepening furrow, as shown in panel Cii. This leads to a failure of normal cytokinesis during the late cleavage period as shown by the presence of multiple syncitial nuclei and an abnormal distribution of kif23-trnc-EGFP (see panel Ciii). Images shown in panels B and C are reconstructed 2-D images from stacks of images captured from the top view of blastomeres undergoing 3rd cleavage. Panels Bi′ and Ci′ are the y–z plane images of panels Bi and Ci, respectively, while panels Bii′ and Cii′ are the x–z plane images of panels Bii and Cii, respectively. |
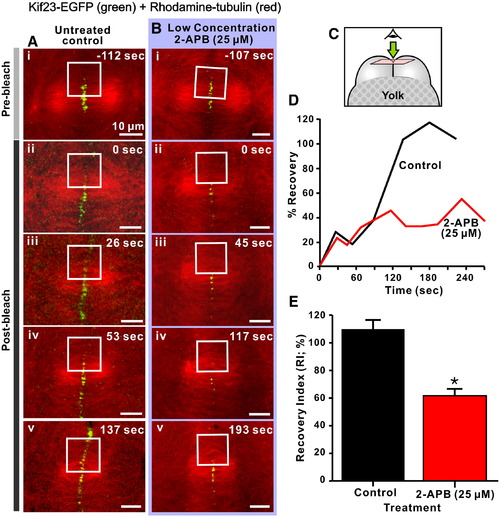
Kif23 recruitment to the cleavage furrow is dependent on Ca2+ released via IP3Rs. Panels A and B illustrate FRAP analysis of kif23-EGFP recruitment to the cleavage furrow of embryos at the 16–32 cell stage. Embryos transiently expressing kif23-EGFP (green label) and with microtubules labeled with rhodamine–tubulin (red label) were either untreated (see panels Ai to Av) or treated with a low concentration (i.e., 25 μM) of 2-APB (see panels Bi to Bv) for FRAP analysis. Kif23-EGFP was recruited to the rhodamine–tubulin labeled microtubules during anaphase, at which time photobleaching was performed in the area marked by white squares using a 50 mW argon–ion 488-nm laser source (for 20 consecutive scans with a scan speed of ~ 4 µs/pixel). Images were then captured until interphase to monitor the recovery of kif23-EGFP fluorescence in the photobleached area. (C) Schematic to indicate the orientation of the optical sections shown in panels A and B. (D) Time-course of the recovery of kif23-EGFP fluorescence following photobleaching in the marked region of the representative control and 2-APB-treated embryos shown in panels A and B, respectively. (E) Comparison of the recovery index (RI) of kif23-EGFP fluorescence at the cleavage furrow after photobleaching in control and 2-APB treated embryos. Data presented are averaged percentages of the RI ± S.E.M. where n = 4 or 5 in each group. The Student′s t-test was performed for statistical analysis. * indicates values that are significantly different from the control (at p < 0.001). |
Reprinted from Developmental Biology, 316(2), Li, W.M., Webb, S.E., Chan, C.M., and Miller, A.L., Multiple roles of the furrow deepening Ca2+ transient during cytokinesis in zebrafish embryos, 228-248, Copyright (2008) with permission from Elsevier. Full text @ Dev. Biol.