
- Title
-
Coordinated cell-shape changes control epithelial movement in zebrafish and Drosophila
- Authors
- Koppen, M., Fernandez, B.G., Carvalho, L., Jacinto, A., and Heisenberg, C.P.
- Source
- Full text @ Development
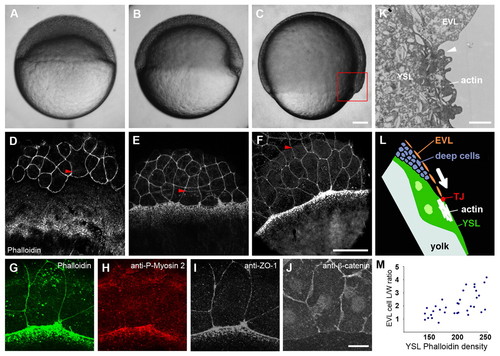
Actin, myosin 2 and ZO-1 become enriched at the EVL-YSL interface. (A-F) Wild-type embryos at dome (A,D), shield (B,E) and 75% epiboly stages (C,F) as bright-field images (A-C) and stained with Phalloidin (F-actin) (D-F). Arrowheads indicate the position of the advancing margin of the deep cells. All zebrafish embryos in these and subsequent panels are displayed with the animal pole at the top unless otherwise indicated. (G-J) Co-staining of the EVL-YSL interface at 75% epiboly with Phalloidin and antibodies against phospho-myosin light chain 2 and ZO-1 (G-I), and single-staining against β-catenin (J). (K) Transmission electron microscopy image of a cross-section through the EVL and YSL at 75% epiboly. Arrowhead points at the EVL-YSL contact. (L) Schematic representation of the boxed region in C, showing the basic organization of the embryonic cell layers. The blastoderm consists of the EVL and deep cell layers and is in contact with the underlying YSL, the surface of the yolk cell. The arrow indicates the movement direction of the blastoderm during epiboly. (M) Relationship between the length/width ratio of individual marginal EVL cells and local Phalloidin signal intensity in the adjacent YSL at 75% epiboly. The values of 34 cells from 6 embryos were plotted. Abbreviations: EVL, enveloping layer; TJ, tight junction; YSL, yolk syncytial layer. Scale bars: in C, 100 μm for A-C; in F, 50 μm for D-F; in J, 25 μm for G-J; in K, 2 μm. |
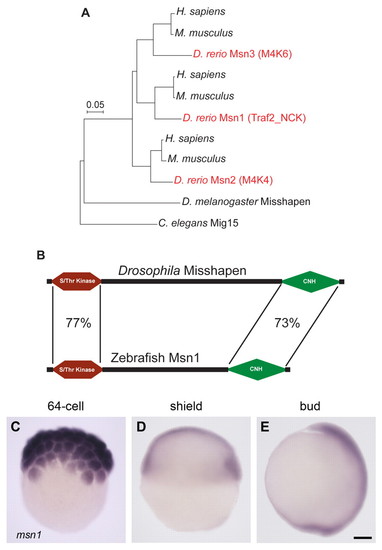
msn1 encodes a zebrafish orthologue of Drosophila Misshapen and is expressed during gastrulation. (A) Phylogenetic analysis of zebrafish homologues (Msn1-3) of Drosophila Misshapen. The scale bar indicates point mutations per site. Msn1 is most closely related to human and mouse Traf2_NCK (Traf2 and NCK interacting kinase). (B) Protein domain comparison of zebrafish Msn1 and Drosophila Misshapen. Percentage amino acid identity between conserved N-terminal Ser/Thr kinase and C-terminal CNH (citron homology) domains is indicated. (C-E) msn1 mRNA expression during early cell division gastrulation stages. In situ hybridization of wild-type embryos at 64-cell (C), shield (D) and bud stages (E). Dorsal is to the right in D and E. Scale bar in E: 100 μm for C-E. |
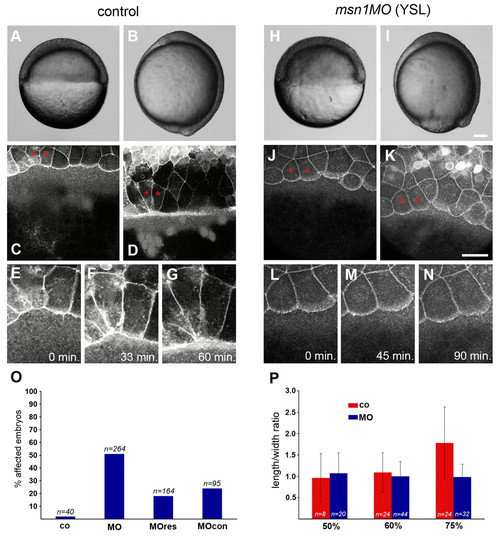
msn1 is required in the YSL for dynamic cell-shape changes of the EVL during epiboly. In this and subsequent figures, zebrafish embryos of the same age are compared unless otherwise stated. (A,B,H,I) Bright-field images of control and YSL-msn1-morphant embryos at 50% epiboly (A,H) and bud stage (B,I). Dorsal is to the right. (C,D,J,K) Images from multi-photon time-lapse analysis of EVL epiboly. The EVL plasma membrane was labeled with GAP-43-GFP. Control and YSL-morphant embryos are shown at 50% epiboly (C,J) and after the EVL margin had advanced approx. 100 μm (D,K). (E-G,L-N) Magnified views of the cells labeled with asterisks in (C,D,J,K). Control (E-G) and morphant cells (L-N) are shown at 50% epiboly (0 min) and at the indicated timepoints. (O) Quantification of epiboly defects resulting from various YSL morpholino injections. Shown are the percentages of embryos displaying delayed epiboly (80-95% epiboly) when uninjected embryos had reached the 100% epiboly stage. Abbreviations: co, control; MO, msn1MO-splice; MOres, msn1MO-splice + msn1 RNA; MOcon, msn1MO-splice5bp. Numbers are based on three independent experiments. (P) Mean and standard deviation of the length/width ratio of cells at the EVL margin in control and morphant embryos at 50%, 60% and 75% epiboly. Scale bars: in I, 100 μm for A,B,H,I; in K, 50 μm for C-G,J-N. PHENOTYPE:
|
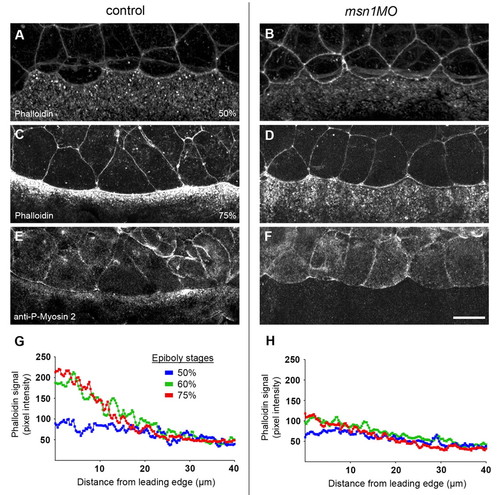
Cell-shape changes of the EVL during epiboly correlate with msn1-mediated recruitment of actin and myosin 2 in the YSL. (A-F) Analysis of actin and myosin 2 localization in control and YSL-morphant embryos. Phalloidin staining of embryos at 50% epiboly (A,B) and co-staining of 75% epiboly embryos with Phalloidin and an anti-phospho-myosin light chain 2 antibody (C-F). (G,H) Intensity profiles of Phalloidin in the YSL in the vicinity of the EVL margin in control (G) and YSL-morphant embryos (H) at 50%, 60%, and 75% epiboly stages. The intensity of the Phalloidin signal was plotted along a line perpendicular to the EVL margin (see Materials and methods). Average plots are shown. Scale bar in F: 25 μm for A-F. PHENOTYPE:
|
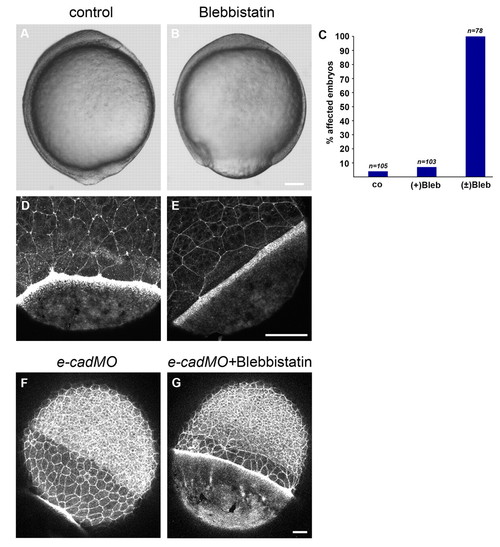
Treatment with the myosin 2 inhibitor blebbistatin decreases actin recruitment in the YSL and slows the rate of EVL epiboly.(A,B) Bright-field image of an untreated embryo at bud stage (A) and a (±)-blebbistatin-treated embryo (B). (C) Quantification of epiboly defects resulting from blebbistatin treatments. Shown are the percentages of embryos displaying delayed epiboly (80-95% epiboly) when untreated embryos had reached the 100% epiboly stage. Numbers are based on two independent experiments. Abbreviations: co, untreated control; (+)Blb, (+)-blebbistatin treatment; (±)Blb, (±)-blebbistatin treatment. (D,E) Phalloidin (F-actin) staining of a control embryo at 75% epiboly and a (±)-blebbistatin-treated embryo. (F,G) Phalloidin staining of an untreated embryo at 90% epiboly (F) and (±)-blebbistatin-treated embryo (G), both injected with a morpholino against half baked/E-cadherin. Scale bars: in B, 100 μm for A,B; in E, 50 μm for D,E; in G, 25 μm for F,G. |
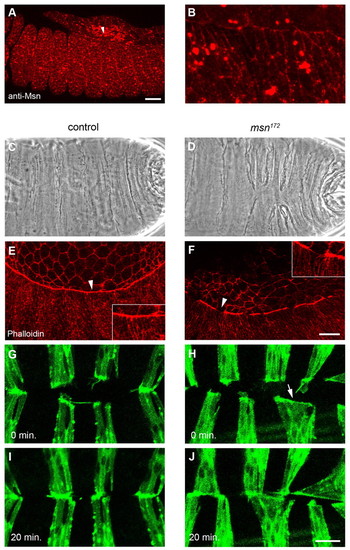
Drosophila misshapen is required for actin-based cell constriction and segment alignment during dorsal closure. (A,B) Anti-Msn antibody staining of a stage 13 control embryo, lateral view with anterior to the left. Arrowhead in (A) indicates the region shown in a magnified view in (B). Large spots probably represent non-specific signal. (C,D) Cuticle preparations of control (C) and msn172 mutant embryos (D) after dorsal closure completion. (E,F) Phalloidin (F-actin) staining of stage 14 control (E) and msn172 mutant embryos (F). Arrowheads demarcate regions shown as insets. (G-J) Time-lapse analysis of the final stages of dorsal closure in control (G,I) and msn172 mutant embryos (H,J) expressing GFP-Actin in the engrailed domain. Embryos are shown at time points 0 min (G,H) and +20 min (I,J). Scale bars: in A, 25 μm for A,B; in F, 25 μm for E,F; in J, 10 μm for G-J. |
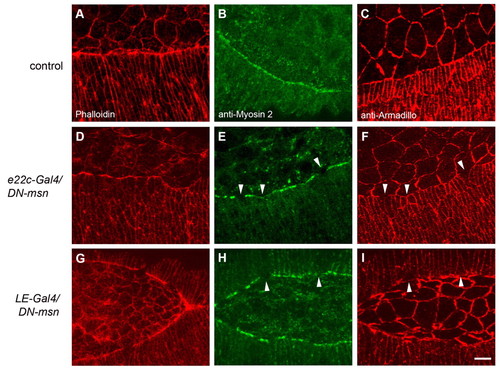
Drosophila misshapen is required in marginal cells of the epidermis for actin and myosin 2 localization and cell constriction. Phalloidin (A,D,G), anti-myosin 2 (B,E,H) and anti-Armadillo (C,F,I) staining of control embryos (A-C) and embryos expressing DN-msn (D-I). e22c-Gal4 (D-F) and LE-Gal4 (G-I) were used to express DN-msn in the whole epidermis or in marginal cells of the epidermis, respectively. (E,F) and (H,I) show myosin 2/Armadillo co-staining. Arrowheads point at areas of disrupted myosin 2 staining correlating with abnormally wide cell shape. Scale bar: 10 μm. |
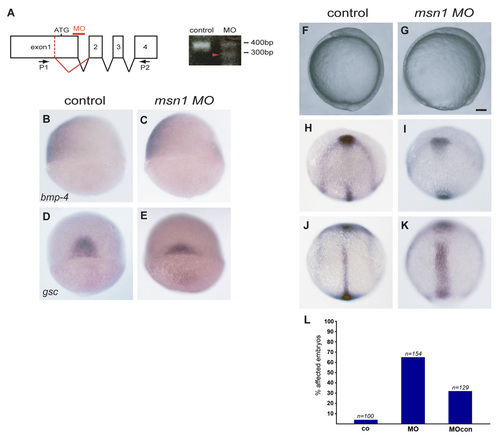
zmsn1 is required for epiboly as well as convergent extension. (A) RT-PCR analysis of msn1 mRNA of embryos injected at the one-cell stage with msn1MO-splice (MO). Primers (P1/P2) flanking the region result in a single 400 bp band in the case of control embryos. In the case of morphants, the level of this band is strongly reduced and a second band (red arrowhead) is visible. The second band results from the use of an alternative splice donor. (B-E) mRNA expression patterns of bmp-4 (B,C, dorsal is to the right) and gsc (D, E, view onto the dorsal side) to determine dorsal-ventral patterning. (F-K) Analysis of the degree of epiboly and convergent extension. Bright-field image of a control embryo at bud stage (F) and an embryo injected with msn1MO-splice at the one cell stage (G). Simultaneous analysis of the mRNA patterns of the axial markers dlx3, hgg1 and ntl in a control (H,J) and morphant (I,K) embryo. (L) Quantification of the penetrance of gastrulaltion defects in uninjected control embryos (co), embryos injected with msn1MO-splice (MO), and embryos injected with msn1MO-splice-5bp (MOcon). Shown are the percentages of embryos displaying delayed epiboly (80-95% epiboly) when uninjected embryos had reached the 100% epiboly stage Scale bar: 100 μm. |

Unillustrated author statements PHENOTYPE:
|