
|
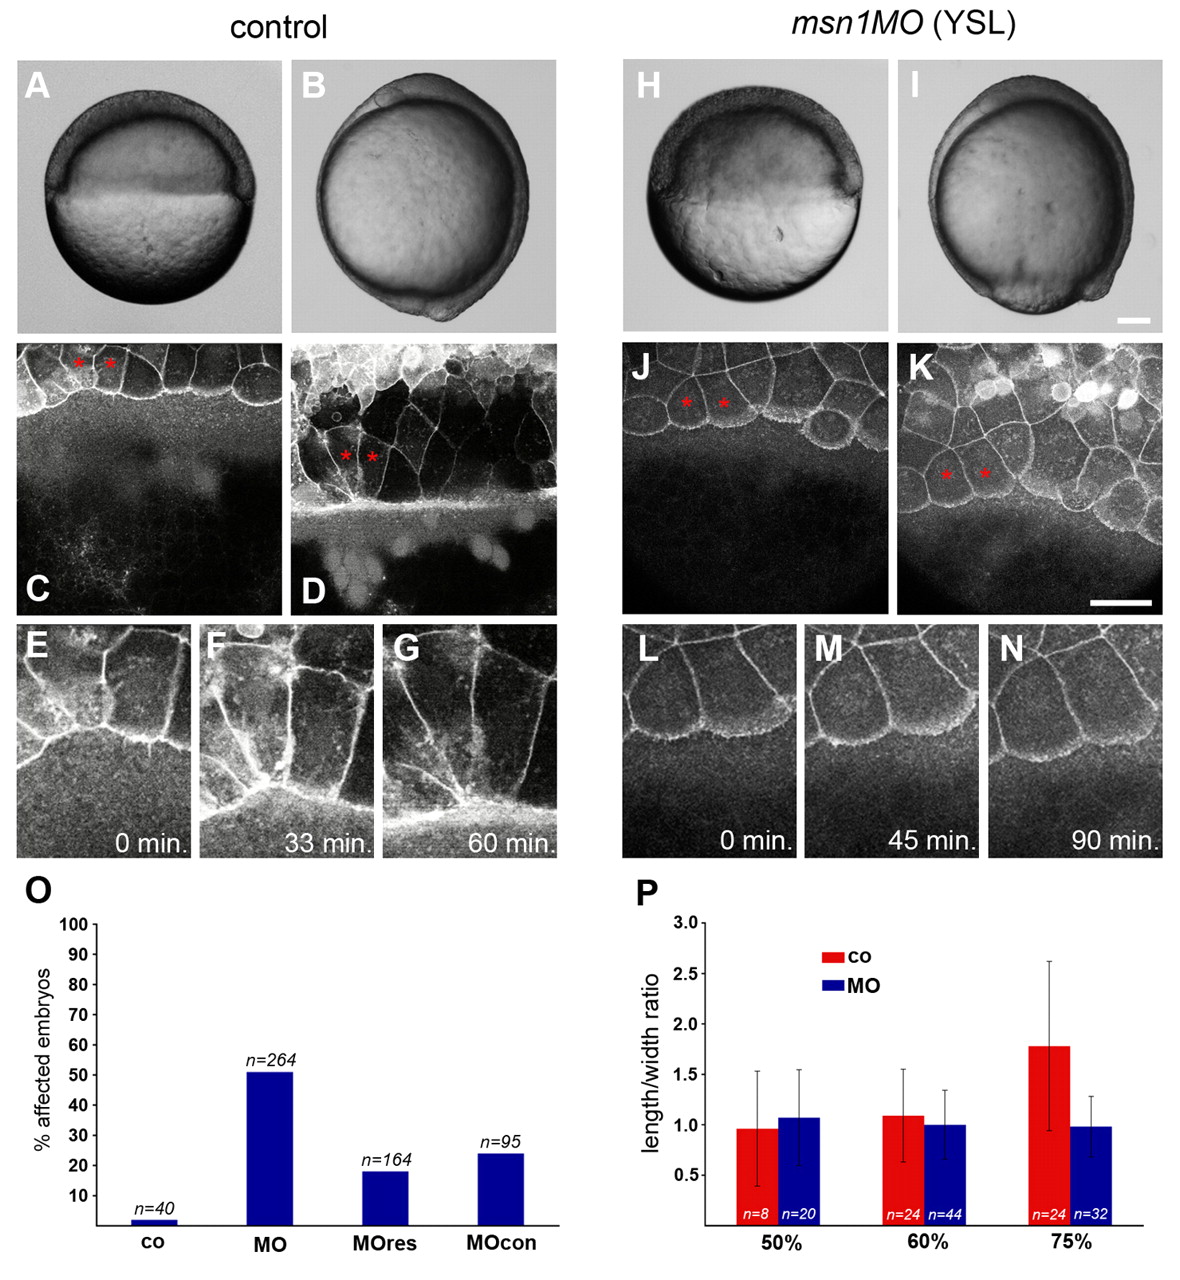
Fig. 3 msn1 is required in the YSL for dynamic cell-shape changes of the EVL during epiboly. In this and subsequent figures, zebrafish embryos of the same age are compared unless otherwise stated. (A,B,H,I) Bright-field images of control and YSL-msn1-morphant embryos at 50% epiboly (A,H) and bud stage (B,I). Dorsal is to the right. (C,D,J,K) Images from multi-photon time-lapse analysis of EVL epiboly. The EVL plasma membrane was labeled with GAP-43-GFP. Control and YSL-morphant embryos are shown at 50% epiboly (C,J) and after the EVL margin had advanced approx. 100 μm (D,K). (E-G,L-N) Magnified views of the cells labeled with asterisks in (C,D,J,K). Control (E-G) and morphant cells (L-N) are shown at 50% epiboly (0 min) and at the indicated timepoints. (O) Quantification of epiboly defects resulting from various YSL morpholino injections. Shown are the percentages of embryos displaying delayed epiboly (80-95% epiboly) when uninjected embryos had reached the 100% epiboly stage. Abbreviations: co, control; MO, msn1MO-splice; MOres, msn1MO-splice + msn1 RNA; MOcon, msn1MO-splice5bp. Numbers are based on three independent experiments. (P) Mean and standard deviation of the length/width ratio of cells at the EVL margin in control and morphant embryos at 50%, 60% and 75% epiboly. Scale bars: in I, 100 μm for A,B,H,I; in K, 50 μm for C-G,J-N.