
- Title
-
Lens opacity and photoreceptor degeneration in the zebrafish lens opaque mutant
- Authors
- Vihtelic, T.S., Yamamoto, Y., Springer, S.S., Jeffery, W.R., and Hyde, D.R.
- Source
- Full text @ Dev. Dyn.
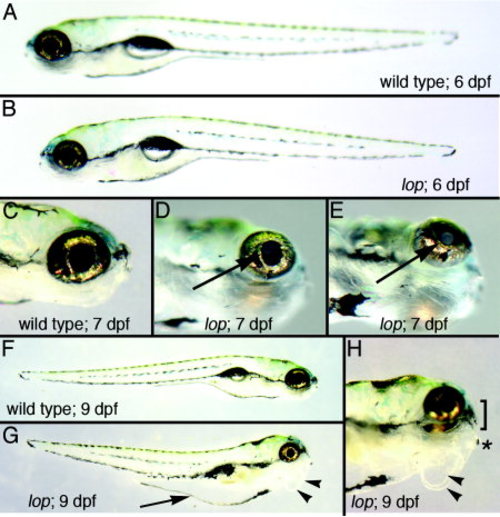
Lens opaque (lop) mutant phenotypes. The panels show stereomicroscopic images of lop mutant fish and wild-type siblings at 6, 7, and 9 days postfertilization (dpf). A,B: At 6 dpf, the lop mutant (B) is nearly indistinguishable from wild-type (A). C-E: Two different mutant eyes at 7 dpf (D,E) exhibited the lens opacity phenotype (arrows) that was absent in the wild-type eye (C). F-H: At 9 dpf, abdominal distention (arrow in G) and clear swellings under the jaw (arrowheads in G,H) characterized the lop mutants (G,H) that were absent in the wild-type fish (F). The lower jaw of the mutant projected anteriorly, and the nose was flattened (H, asterisk and bracket, respectively). |
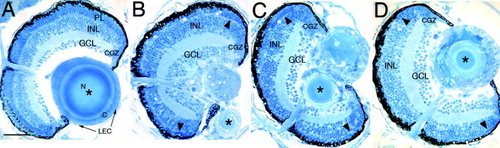
Histological analysis. A-D: Three-micrometer plastic sections were stained with methylene blue and azure II. A: In the 7 days postfertilization wild-type eye, the three retinal layers, which include the ganglion cell (GCL), inner nuclear (INL), and photoreceptor layer (PL) can be identified. The circumferential germinal zone (CGZ) is located at the peripheral margin of the retina. In addition, the wild-type lens epithelial cells (LEC), cortex (C), and nucleus (N) are evident. B-D: Three different lop mutant eyes are shown. The lens structure is severely altered in all three fish, with the putative nucleus labeled by an asterisk. In addition, the mutant retinas lack a distinct photoreceptor layer, although groups of photoreceptors may exist at the periphery (arrowheads). Scale bar = 50 µm. PHENOTYPE:
|
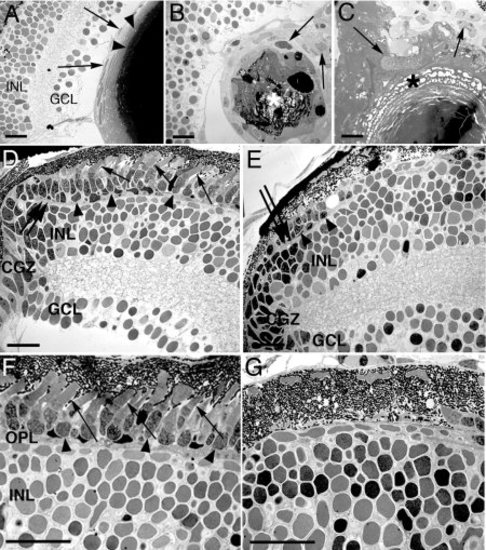
Transmission electron microscopy of the lens and retina. A: The 7 days postfertilization (dpf) wild-type lens epithelial cells and underlying fiber cells are shown (arrows and arrowheads, respectively). B,C: Two different mutant lenses are shown. The mutant lenses display fiber degeneration in the lens nucleus and altered lens epithelial cell morphology (asterisks and arrows, respectively). D,F: The wild-type photoreceptor layer at the retinal margin and the central retina, respectively. The photoreceptor cell bodies and outer segments are labeled with arrowheads and arrows, respectively. E,G: In the mutant retina, a few remaining photoreceptor layer cell bodies are identified at the retinal margin (E, arrowheads), although no photoreceptor outer segments are evident. G: Similarly, the mutant central retina lacks identifiable photoreceptor cells. The outer plexiform layer in D and E is marked with a double arrow. INL, inner nuclear layer; GCL, ganglion cell layer; CGZ, circumferential germinal zone; OPL, outer plexiform layer. Scale bars = 20 µm in A-G. |
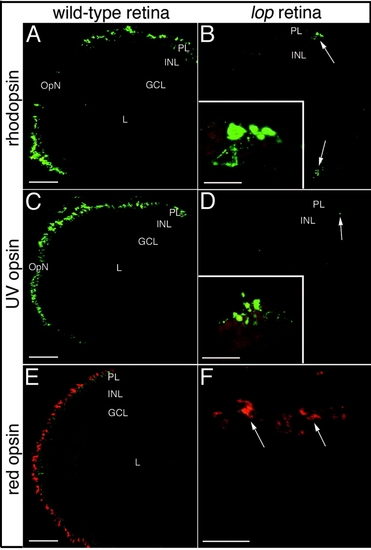
Rod and cone opsin immunolocalization in wild-type and lop mutant retinas. A,C,E: Immunolocalization of rhodopsin (rods), ultraviolet (UV) opsin (short single cones), and red opsin (double cone cell member), respectively, in wild-type frozen retinal sections. B,D,F: The corresponding localization patterns in the mutant retinas. The rhodopsin and UV opsin proteins are restricted to the retinal margins of the mutants (B and D, respectively; arrows). The insets show higher magnification images of the few remaining opsin-expressing cells located at the retinal margins. Red opsin expression in the mutant retinas was also limited to the retinal marginal zone. E,F: The wild-type red opsin expression pattern and a high magnification image of the red opsin-expressing cells at the mutant retinal margin (arrows) are shown in E and F, respectively. PL, photoreceptor layer; INL, inner nuclear layer; GCL, ganglion cell layer; OpN, optic nerve; L, lens. Scale bars 50 μm in A,C,E, 20 μm in B,D,F. EXPRESSION / LABELING:
|
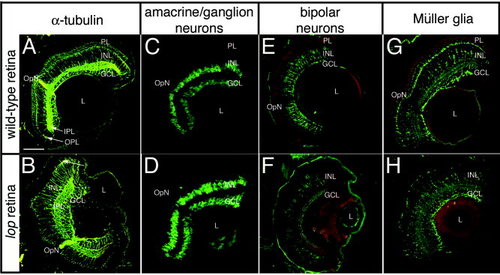
Retinal structure and cell type identification in wild-type and lop mutants. Wild-type (A,C,E,G) and lop mutant retinas (B,D,F,H) were stained with different antibodies to examine the retinal organization. A,B: The α-tubulin antiserum, which stains a component of the retinal cell cytoskeleton, shows a nearly identical pattern in the wild-type and lop mutant (A and B, respectively). B: The major difference is the presence of the wild-type photoreceptor layer that is significantly reduced in the lop mutant (arrow). C,D: The amacrine and ganglion cells, which were identified by immunolocalization of the RNA-binding protein HuC/D, are largely identical in wild-type (C) and mutant (D) retinas. E,F: The subset of retinal bipolar cells that are stained with the anti-PKC are equivalent in wild-type and lop (E and F, respectively). G,H: Müller cells, which were identified by glutamine synthetase detection, were also equivalent in the wild-type (G) and mutant (H) retinas. PL, photoreceptor layer; INL, inner nuclear layer; GCL, ganglion cell layer; IPL, inner plexiform layer; OPL, outer plexiform layer; OpN, optic nerve; L, lens. Scale bar = 50 µm. |
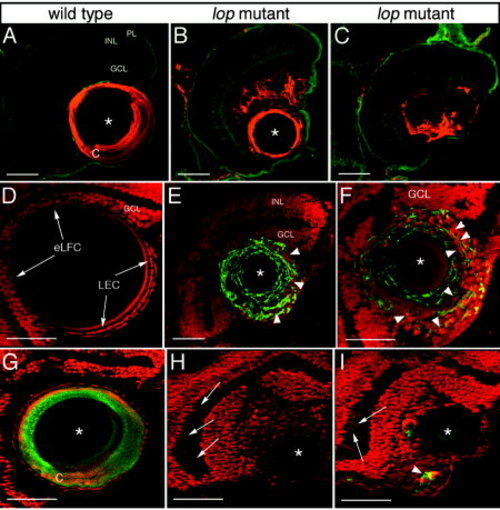
zl-1 and actin expression in the lop lens and retina. A-F: The lens structure is highlighted by immunodetection of the zl-1 antigen. A-C: The zl-1 spatial distribution in the 7 days postfertilization wild-type lens is shown in A, whereas two different mutant lenses are shown in B and C. E,F: The zl-1-labeled (arrowheads) mutant section (F is at higher magnification) was also stained with propidium iodide to visualize the lens and retinal nuclei. D: For comparison, a wild-type propidium iodide-stained lens is shown. The lens epithelial cells (LEC) and elongating fiber cells (eLFC) are visualized (arrows). G-I: Propidium iodide-stained frozen sections whose actin was labeled using phalloidin-AlexaFluor 488 (green). G: Strong actin staining is localized to the lens cortex of the wild-type lens. H,I: The two different mutants demonstrate reduced actin expression in the lens, aberrant actin localization (I, arrowhead) and fusiform-shaped nuclei within the inner retinal layers (H,I, arrows). Asterisks denote the central lens nuclear regions. PL, photoreceptor layer; INL, inner nuclear layer; GCL, ganglion cell layer; eLFC, elongating fiber cells; LEC, lens epithelial cells; C, lens cortex. Scale bars = 50 µm in A-I. |
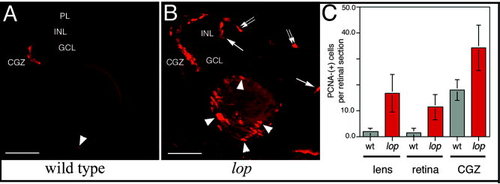
Cell proliferation in the lens and retina. Proliferating cell nuclear antigen (PCNA) immunolabeling detected proliferating cells in the retina and lens. A: A few PCNA-positive cells at the retinal margin (circumferential germinal zone [CGZ]) and a single cell in the lens epithelial cell layer of a wild-type eye (arrowhead). B: Large numbers of PCNA-labeled cells in the lop mutant lens (arrowheads) and retina. In the mutant retina, the PCNA-positive cells are located within the CGZ and the distal (arrows) and proximal (double arrows) aspects of the inner nuclear layer. C: The PCNA-positive cells were quantified in the wild-type and lop mutant lens, retina, and CGZ. Error bars show SD (n values, see Experimental Procedures section and Table 1). PL, photoreceptor layer; INL, inner nuclear layer; GCL, ganglion cell layer; CGZ, circumferential germinal zone; wt, wild-type. Scale bars = 50 µm in A,B. |
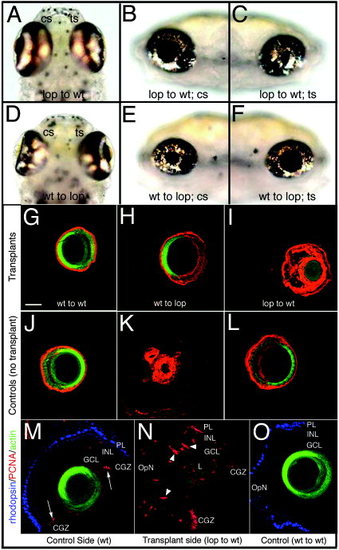
Lens transplantations. A-C: A wild-type (wt) fish with transplanted mutant lens. A: The wild-type lens in the nonoperated eye (cs) appears normal, while the transplanted mutant lens (ts) is not visible. B,C: Lateral views of control (B) and transplant eyes (C) are shown. D-F: A lop mutant with transplanted wild-type lens; the ventral (D) and lateral views of the control side (E) and the transplant side (F) are shown. G-I: Transplanted lens immunohistochemistry is shown (anti-zl-1, red; phalloidin, green). J-L: Controls. M-O: In some cases, mutant lens transplantation into wild-type caused photoreceptor degeneration. M: The control eye displays rod photoreceptors (blue) and proliferating cells at the retinal margin (red; arrows). Lens structure was visualized by phalloidin-AF488 staining (green). N: The wild-type eye with mutant lens lacks rods and exhibits proliferating INL cells (arrowheads). O: Transplantation of a wild-type lens into a wild-type eye is shown. PL, photoreceptor layer; INL, inner nuclear layer; GCL, ganglion cell layer; OpN, optic nerve; CGZ, circumferential germinal zone; L, lens; cs, control side; ts, transplant side. Scale bar = 50 µm in G (applies to A-O). |

Unillustrated author statements EXPRESSION / LABELING:
|