
- Title
-
Gnotobiotic zebrafish reveal evolutionarily conserved responses to the gut microbiota
- Authors
- Rawls, J.F., Samuel, B.S., and Gordon, J.I.
- Source
- Full text @ Proc. Natl. Acad. Sci. USA
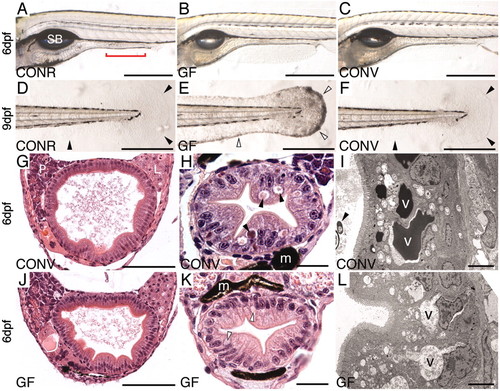
Morphologic studies of CONR, CONV, and GF zebrafish. (A-C) Whole-mount preparations of 6-dpf zebrafish. Rostral is to the left, dorsal is to the top. A shows the position of the swim bladder (SB) and the boundary of intestinal segment 2 (red bracket). Segments 1 and 3 lie rostral and caudal to segment 2, respectively. (D-F) Whole mounts of the caudal regions of 9-dpf CONR, GF, and CONV (conventionalized at 3 dpf) animals, showing onset of epidermal degeneration phenotype in GF fish. This phenotype is manifested by loss of transparency and integrity of the epidermis in fin folds (the edges of these fin folds are highlighted with open arrowheads in E). CONR and CONV fin folds remain transparent (edges indicated by filled black arrowheads in D and F). (G, H, J, and K) Hematoxylin- and eosin-stained transverse sections showing intestinal segment 1 (G and J) and segment 2 (H and K) in 6-dpf CONV and GF zebrafish. There are no detectable epithelial abnormalities in intestinal segment 1, whether judged by light microscopy (G and J) or by transmission EM (data not shown). In contrast, enterocytes in segment 2 contain prominent supranuclear vacuoles filled with eosinophilic material in CONV (and CONR) fish (e.g., black arrowheads in H). These vacuoles appear clear in GF animals (e.g., open arrowheads in K). Pigmented melanocytes (m) lie adjacent to the intestine in H and K. (I and L) EM study of 6-dpf intestines, showing electron-dense material in the supranuclear vacuoles (v) of segment 2 CONV enterocytes, and electron-lucent material in GF enterocytes. The filled black arrowhead in I points to a bacterium in the intestinal lumen. (Bars: 500 μm in A-F; 100 μmin G and J;20 μmin H and K; 5 μmin I and L.) |
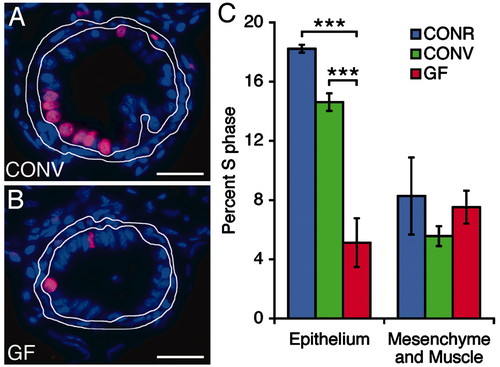
The microbiota stimulates intestinal epithelial proliferation. (A and B) Sections prepared from the intestines of 6-dpf CONV and GF zebrafish after a 24-h exposure to bromodeoxyuridine in their environmental water. Sections were stained with antibodies to bromodeoxyuridine (magenta) and the nuclear stain bisbenzimide (blue). The mesenchyme and muscle surrounding the intestinal epithelium are outlined in white. (C) Quantitation of S-phase cells in the intestinal epithelium and mesenchyme. The percentage of cells in S phase in GF intestinal epithelium is significantly lower than in CONR or CONV animals (P < 0.0001, indicated by brackets with three asterisks). Data are expressed as the mean of two independent experiments ± SEM (n = 19-31 sections scored per animal; ≥6 animals per experiment). (Bars: 25 μm in A and B.) |