
- Title
-
Origin and development of the zebrafish endoderm
- Authors
- Warga, R.M. and Nüsslein-Volhard, C.
- Source
- Full text @ Development
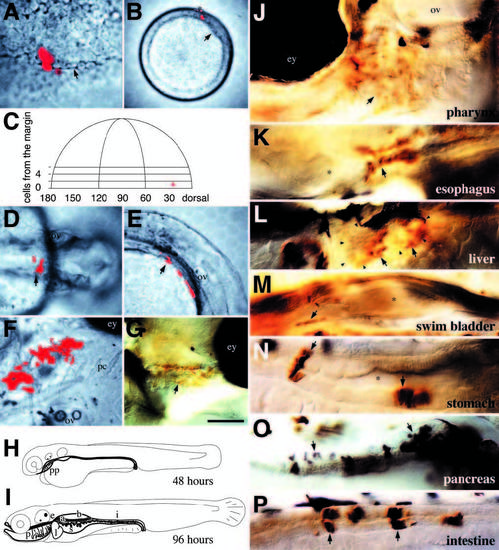
The method used for making the fate map for endoderm. A single cell on the blastoderm margin was co-injected with rhodamineand biotin-dextran at mid-blastula (1000-cell stage, 3 hours). (A) At 40% epiboly, the clone (now 4 deep cells and 1 enveloping layer cell; asterisk) was examined in face view. The distance of each cell from the blastoderm margin (arrow) was measured in terms of cell diameters. In this clone, one cell lies just below the margin and was designated in tier 0, the other cells were in tiers 1 and 2. (B) At shield stage, the clone was re-examined from an animal pole view. Frequently, the number of deep cells was the same. The distance between the dorsal midline (arrow) and the center of the clone was measured in degrees of arc. By now, all labeled deep cells had involuted; asterisk, enveloping layer cells. (C) Depiction of the blastoderm at 40% epiboly and the position of the mapped clone. Although the clone was on the right, it is projected to the left side of the blastoderm for conventional presentation (Kimmel et al., 1990). (D,E) At 30 hours, the deep cell clone formed part of an epithelial layer overlying the yolk sac. (D) Dorsal view. (E) Lateral view. The arrow indicates the same group of cells. (F,G) By 96 hours, the deep cell clone had become pharyngeal endoderm within the gills. (F) Ventral oblique view of the live embryo, anterior to the right. The clone, between the right eye and left ear, was near pharyngeal cartilage. (G) Lateral view, after whole-mount staining for the fixable tracer. The cells of the endodermal clone, now stained brown (arrow), formed a simple squamous epithelium covering the gills. (H,I) Depiction of the developing digestive tract (bold outline). (H) At 48 hours, the gut tube. Only the pharyngeal pouches, early pharynx, have noticeably differentiated. (I) At 96 hours, the gut is fully differentiated. The subdivisions include (progressing rostro-caudally): the pharynx (including gills), the esophagus, the stomach and the intestine. The liver (left), swimbladder (medial), and pancreas (right; shaded) are diverticula of the gut. (J-P) Whole-mount-stained clones between 96 and 120 hours of development illustrating differentiated endodermal tissues. (J-M,P) are left side presentations, (N,O) are right side; arrows indicate labeled cells within each structure; asterisks indicate lumens. (J) Pharynx: simple squamous epithelium. (K) Esophagus: stratified squamous epithelium. (L) Liver (outlined in arrowheads): parenchymal cells. (M) Swimbladder: pseudostratified squamous epithelium. (N) Stomach: simple columnar epithelium. (O) Pancreas: parenchymal cells containing prominent vesicles (putative zymogen granules). (P) Intestine: simple columnar epithelium. Scale bar: 50 μm (A,F,G), 200 μm (B), 100 μm (D,E), 25 μm (J-P). Abbreviations: a, pancreas; b, swimbladder; e, esophagus; i, intestine; l, liver; p, pharynx; s, stomach; ey, eye; ov, ear; pc, pharyngeal cartilage; pp, pharyngeal pouches. |
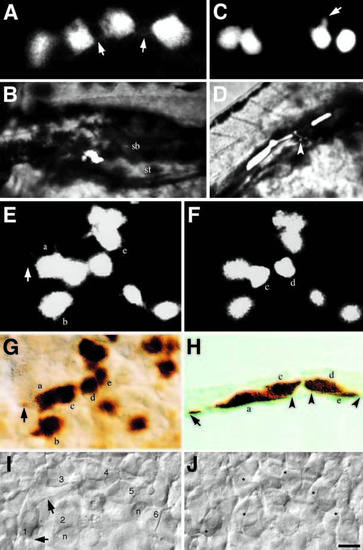
Endodermal precursors occupy a stereotypic depth in the hypoblast. (A) Flattened cells, characteristic of the endodermal precursors in the late gastrula; note faint filopodia (arrows). At 100% epiboly, these cells were located directly adjacent to the yolk cell. (B) By 96 hours, these cells had differentiated into swimbladder tissue (sb) neighboring the stomach (st). (C) Rounded cells, characteristic of mesodermal precursors in the late gastrula; note lack of filopodia, however some cells show protrusive activity (arrow). At 90% epiboly, these cells were intermingled within a coherent layer of unlabeled cells of similar morphology one cell diameter up from the yolk cell. (D) By 30 hours, these cells had differentiated into paraxial muscle and 1 endothelial cell (arrow). (E-H) Five clones were examined at 90% epiboly and then immediately fixed, stained and sectioned. Illustrated is one example. The clone in the live embryo, deep (E) and superficial (F) planes of focus. Cells a, b and e are large and flattened endodermal precursors; one of several filopodia on cell a is indicated (arrow). Cells c and d are smaller and rounder mesodermal precursors, note cell c partially overlies cell a. (G) The same cohort of cells in the whole-mount preparation; note the filopodia on cell a (arrow). (H) Transverse section (10 mm) through cells a, c, d, and e. Both cell a and e are in the deepest hypoblast cell layer, beneath cells c and d. The extremities of cell a and e are indicated with arrowheads and an arrow, which further indicates the filopodia on cell a. (I,J) Unlabeled cells in the live embryo at 100% epiboly. The field of view is located 45° away from the dorsal midline near the level of the equator, because the embryo is spherical, cells at the bottom of the field are in a deeper plane of focus than cells at the top. (I) Deep plane of focus, six endodermal precursor cells (indicated with numerals) – each cell spaced roughly one cell diameter apart from one another – overlay the yolk cell whose nuclei (n) are also in focus. Filopodia (arrows) on cell 1 are indicated. (J) Superficial plane of focus, a layer of mesodermal precursor cells lie above the endodermal cells. Mesodermal precursor cells form a coherent layer – there are no spaces between cells. Asterisk denotes the positions of the underlying endoderm cells. Notice cells 1, 4 and 5 are partially visible. Scale bar: 10 μm (A,C, E-G, and I,J), 50 μm (B,D), 5 μm (H). |
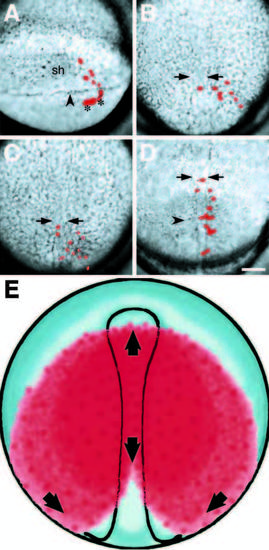
Endodermal precursors are stereotypically distributed in the late gastrula. (A-D) Illustrate the convergence of endodermal precursors towards the dorsal midline from selected composite frames of a time-lapse video. Labeled cells are pseudocolored red. (A) The clone at shield stage, consisting of six deep cells and four enveloping layer cells (asterisks), to the right of the embryonic shield (sh). The labeled deep cells have already involuted deep into the hypoblast; arrowhead, blastoderm margin. (B) By 80% epiboly, labeled cells have begun to converge towards the embryonic axis whose boundaries are indicated with arrows for this and subsequent panels. (C) By 100% epiboly, labeled cells have begun to spread towards the animal pole. (D) At the 4-somite stage, the labeled cells now extend anterior-posteriorly along the axis. The more anterior cells were in the prechordal plate and gave rise to pharynx, a common prechordal plate derivative in our data set, the more posterior cells gave rise to liver, swimbladder and stomach; arrowhead, first somite furrow. (E) Illustrates the spatial distribution of endodermal precursors in the late gastrula based on our data. Red indicates where cells of the endoderm were observed, and arrows indicate directions cells move to meet at the dorsal midline and spread antero-posteriorly. Scale bar: 100 μm. |
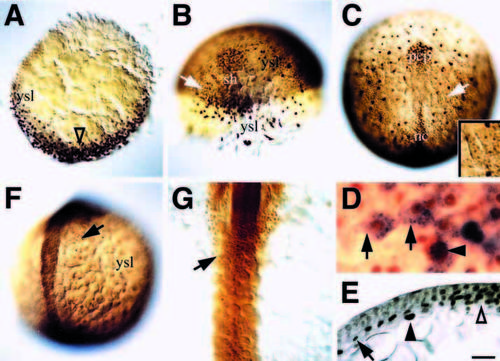
Fkd2 protein is an early marker of endodermal precursors. (A) Dome stage, animal pole view; presumptive dorsal side (open arrowhead). (B) 60% epiboly, dorsal oblique view; presumptive endoderm precursor cells in focus on the left side (arrow) and larger, more irregular-shaped yolk syncytial nuclei in focus on the right side. (C) 90% epiboly, dorsal view; the lateral wing of endoderm precursor cells (arrow). Inset is a closeup of this location showing smaller endoderm nuclei, and larger yolk cell nuclei. (D) 90% epiboly, higher magnification showing characteristic endoderm precursor cells (arrows) labeled in vivo with fixable lineage tracer and then fixed and stained for the tracer (blue) and Fkd2 immunoreactivity (brown); 23 cells were analyzed in this manner. Arrowhead indicates a Fkd2-positive yolk cell nucleus. (E) 90% epiboly, transverse section (10 μm) through the midline (open arrowhead), showing one of several cell nuclei in the endodermal layer (arrow) and an underlying yolk cell nucleus (arrowhead). (F) 10-somite stage, dorsal oblique view; endodermal cells in focus on the right side (arrow). (G) 18-somite stage, dorsal view; endodermal cell sheet (arrow) in midline. Scale bar: 100 μm (A-C, F), 50 μm (G, and inset C), 20 μm (E), 10 μm (D); abbreviations: nc, notochord; pcp, prechordal plate; sh, shield; ysl, yolk syncytial nuclei. EXPRESSION / LABELING:
|
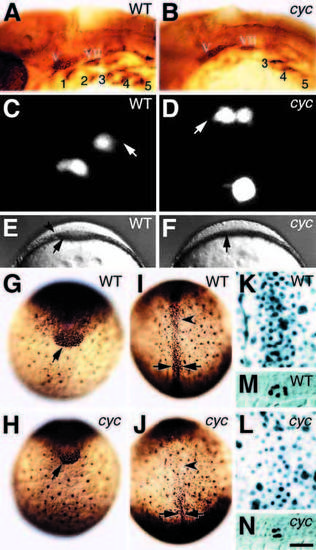
Embryos mutant for cyclops have fewer dorsal endodermal and mesodermal precursors. (A,B) 30 hour embryos, side view, labeled with Zn8 antibody. The antibody labels the cell surfaces of the pharyngeal pouches (indicated by numerals 1-5) and sensory neurons in the cranial ganglia. (C,D) 100% epiboly, dorsal view; endodermal precursor cells in the prechordal plate of live embryos appear similar in both wild-type and mutant; arrows, filopodia. The very round and intensely bright cell in the lower field in D is preparing to divide and did so immediately after this image was captured. Progeny of both clones later gave rise to pharyngeal endoderm. (E,F) 90% epiboly, front view; the prechordal plate (arrow) is noticeably thinner in mutant embryos, and lacks a visible lateral boundary (arrowhead). (G-J) 100% epiboly stage embryos labeled with anti-Fkd2 illustrating the anterior prechordal plate (arrow); the posterior prechordal plate (arrowhead); and the notochord (between arrows). (K,L) Higher magnification of embryos (I,J) showing the endodermal precursors in a deep plane of focus. The boundary between prechordal plate endoderm and notochord, obvious in the cyclops embryo, is towards the lower field. (M,N) 100% epiboly stage embryos labeled with anti-Ntl, a notochord-specific marker. Shown is a transverse section (10 μm) mid-trunk through the embryo. Using a 40x lens, we counted all the intensely labeled Fkd2-positive nuclei in the anterior prechordal plate (wt: median = 195, n=3; cyclops: median = 106, n=3). Similarly, we counted all labeled nuclei in a 100x100 μm field of the posterior prechordal plate (wt: median = 409, n=3; cyclops: median = 210, n=3) and the notochord (wt: median = 217, n=3; cyclops: median = 120, n=3). Endodermal precursors, labeled nuclei adjacent to the yolk, comprise a subset of the prechordal plate field (wt: median = 127, n=3; cyclops: median = 60, n=3). Scale bar: 100 μm (A,B, E,F and G-J), 25 μm (K-N), 8 μm (C,D); abbreviations: V, trigeminal ganglion; VII, facial ganglion. PHENOTYPE:
|