FIGURE SUMMARY
Title

Differential proinflammatory activities of Spike proteins of SARS-CoV-2 variants of concern

Authors
Tyrkalska, S.D., Martínez-López, A., Arroyo, A.B., Martínez-Morcillo, F.J., Candel, S., García-Moreno, D., Mesa-Del-Castillo, P., Cayuela, M.L., Mulero, V.
Source
Full text @ Sci Adv

Fig. 1. WT S1 is highly proinflammatory in zebrafish.
Recombinant S1WT (+), BSA, or vehicle (−) were injected in the hindbrain ventricle (HBV) of 2–day postfertilization (dpf) Tg(mpx:eGFP) (A), Tg(mfap4:mCherry) (B), Tg(nfkb:eGFP) (C), and WT (D to F) larvae. Neutrophil (A) and macrophage (B) recruitment and number and Nfkb activation (C) were analyzed at 6, 12, and 24 hpi by fluorescence microscopy, the transcript levels of the indicated genes (D) were analyzed at 12 hpi by RT-qPCR in larval head and tail (except for ifng that was also analyzed at 6 hpi in the head) (E), and caspase-1 activity was determined at 24 hpi using a fluorogenic substrate (F). As a control, S1WT was also used preheated at 80°C for 30 min (S1-80). Each dot represents one individual, and the means ± SEM for each group is also shown. P values were calculated using one-way analysis of variance (ANOVA) and Tukey multiple range test. RT-qPCR data are depicted as a heatmap in (D) with higher expression shown in darker color. ns, not significant; *P ≤ 0.05, **P ≤ 0.01, and ***P ≤ 0.001. auf, arbitrary units of fluorescence.

Fig. 2. WT S1 signals through the canonical inflammasome in zebrafish.
Recombinant S1WT or vehicle (−) were injected in the hindbrain ventricle (arrowheads) of 2-dpf Tg(mpx:eGFP) (A) and WT (B and C) larvae in the presence of either dimethyl sulfoxide (DMSO) or the caspase-1 inhibitor VX-765 (VX). Neutrophil recruitment and number were analyzed at 3 hpi by fluorescence microscopy (A), the transcript levels of the indicated genes were analyzed at 12 hpi by RT-qPCR (B), and caspase-1 activity was determined at 24 hpi using a fluorogenic substrate (C). Representative images of whole Tg(mpx:eGFP) larvae for each treatment are also shown (A). Each dot represents one individual and the means ± SEM for each group is also shown. RT-qPCR data are depicted as a heatmap in (B) with higher expression shown in darker color. P values were calculated using one-way ANOVA and Tukey multiple range test. *P ≤ 0.05, **P ≤ 0.01, and ***P ≤ 0.001. Scale bar, 500 μm.

Fig. 3. Ace2 deficiency exacerbates the proinflammatory activity of S1WT in zebrafish.
One-cell-stage zebrafish eggs of Tg(mpx:eGFP) (A and H), Tg(mfap4:mCherry) (B), Tg(nfkb:eGFP) (C), and WT (D to G) were microinjected with control or ace2 crRNA-Cas9 complexes. At 2 dpf, recombinant S1WT, flagellin, or vehicle (−) was injected alone or in combination with Ang (1-7) in the hindbrain ventricle of control and Ace2-deficient larvae. Neutrophil (A and H) and macrophage (B) recruitment and number and Nfkb activation (C) were analyzed at 6, 12, and 24 hpi by fluorescence microscopy; the transcript levels of the indicated genes were analyzed at 12 hpi by RT-qPCR (D, F, and G); and caspase-1 activity was determined at 24 hpi using a fluorogenic substrate (E). Each dot represents one individual and the means ± SEM for each group is also shown. RT-qPCR data are depicted as a heatmap in (D) with higher expression shown in darker color. P values were calculated using one-way ANOVA and Tukey multiple range test. *P ≤ 0.05, **P ≤ 0.01, and ***P ≤ 0.001.

Fig. 4. S1γ variant is more proinflammatory than the S1WT.
Recombinant S1WT, S1γ, or vehicle (−) were injected in the hindbrain ventricle of 2-dpf larvae of Tg(mpx:eGFP) (A), Tg(mfap4:mCherry) (B), Tg(nfkb:eGFP) (C), and WT (D and E). Neutrophil (A) and macrophage (B) recruitment and number and Nfkb activation (C) were analyzed at 6, 12, and 24 hpi by fluorescence microscopy; the transcript levels of the indicated genes were analyzed at 12 hpi by RT-qPCR (D); and caspase-1 activity was determined at 24 hpi using a fluorogenic substrate (E). Each dot represents one individual and the means ± SEM for each group is also shown. RT-qPCR data are depicted as a heatmap in (D) with higher expression shown in darker color. P values were calculated using one-way ANOVA and Tukey multiple range test. *P ≤ 0.05, **P ≤ 0.01, and ***P ≤ 0.001.

Fig. 5. S1δ is less proinflammatory than the S1WT.
Recombinant S1WT, S1δ, or vehicle (−) were injected in the hindbrain ventricle of 2-dpf larvae of Tg(mpx:eGFP) (A), Tg(mfap4:mCherry) (B), Tg(nfkb:eGFP) (C), and WT (D and E). Neutrophil (A) and macrophage (B) recruitment and number and Nfkb activation (C) were analyzed at 6, 12, and 24 hpi by fluorescence microscopy; the transcript levels of the indicated genes were analyzed at 12 hpi by RT-qPCR (D); and caspase-1 activity was determined at 24 hpi using a fluorogenic substrate (E). Each dot represents one individual and the means ± SEM for each group is also shown. RT-qPCR data are depicted as a heatmap in (D) with higher expression shown in darker color. P values were calculated using one-way ANOVA and Tukey multiple range test. *P ≤ 0.05, **P ≤ 0.01, and ***P ≤ 0.001.

Fig. 6. S1β shows delayed but stronger proinflammatory activity than the S1WT.
Recombinant S1WT, S1β, or vehicle (−) were injected in the hindbrain ventricle of 2-dpf larvae of Tg(mpx:eGFP) (A), Tg(mfap4:mCherry) (B), Tg(nfkb:eGFP) (C), and WT (D and E). Neutrophil (A) and macrophage (B) recruitment and number and Nfkb activation (C) were analyzed at 6, 12, and 24 hpi by fluorescence microscopy; the transcript levels of the indicated genes were analyzed at 12 hpi by RT-qPCR (D); and caspase-1 activity was determined at 24 hpi using a fluorogenic substrate (E). Each dot represents one individual and the means ± SEM for each group is also shown. RT-qPCR data are depicted as a heatmap in (D) with higher expression shown in darker color. P values were calculated using one-way ANOVA and Tukey multiple range test. *P ≤ 0.05, **P ≤ 0.01, and ***P ≤ 0.001.

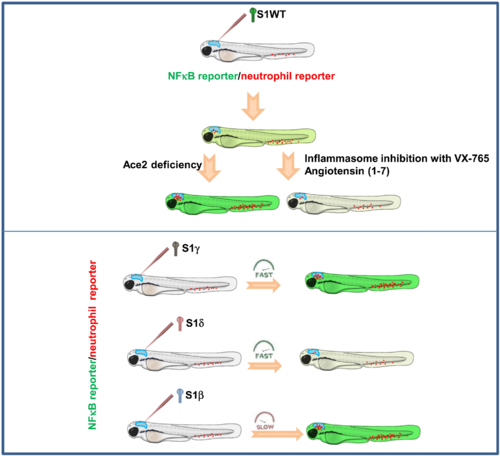
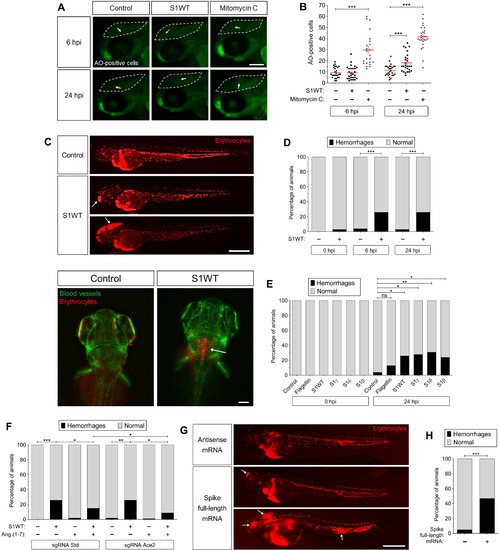
Fig. 7. Recombinant S1 proteins provoke hemorrhages in zebrafish larvae.
(A and B) WT larvae were injected with S1WT protein, mitomycin C, or vehicle (−) in the hindbrain ventricle at 2 dpf and the number of cell death in the brain analyzed at 6 and 24 hpi by acridine orange (AO) staining. (C to F) One-cell-stage zebrafish eggs of Tg(gata1a:dsRed)/Tg(fli1a:eGFP) were microinjected with control or ace2 crRNA-Cas9 complexes. At 2 dpf, S1 proteins or flagellin were injected in the hindbrain ventricle alone or with Ang (1-7). Hemorrhages were analyzed at 0, 6, and 24 hpi. (G and H) Zebrafish eggs of Tg(gata1a:dsRED) were microinjected with control or full-length S RNAs, and hemorrhages were analyzed at 48 hpf. Representative images showing AO+ cells (A) and hemorrhages (white arrows) (C and G). P values were calculated using one-way ANOVA and Tukey multiple range test (B) and Fisher’s exact test (D, E, G, and H). (D) 0 hpi + H2O, n = 34; 0 hpi + S1WT, n = 50; 6 hpi + H2O, n = 50; 6 hpi + S1WT, n = 60; 24 hpi + H2O, n = 52; and 24 hpi + S1WT, n = 60. (E) 0 hpi + H2O, 35; 0 hpi + flagellin, n = 35; S1WT, n = 47; S1γ, n = 40; S1δ, n = 42; S1β, n = 46. (F) crSTD + H2O, n = 92; crSTD + S1WT, n = 85; crSTD + ANG (1-7), n = 83; crSTD + S1WT + ANG (1-7), n = 87; crAce2 + H2O, n = 76; crAce2 + S1WT, n = 83; crAce2 + ANG (1-7), n = 90; crAce2 + S1WT + ANG (1-7), n = 81. *P ≤ 0.05, **P ≤ 0.01, and ***P ≤ 0.001. Scale bars, 100 μm (A), 500 μm (top of C, and G), 50 μm (bottom of C).

Fig. 8. Human mononuclear cells and neutrophils failed to respond to recombinant S proteins.
PBMCs (A) and neutrophils (B) from healthy donors and white blood cells (WBC) from the synovial fluid of a patient with recent onset oligoarticular juvenile idiopathic arthritis (JID) (C) were stimulated for 4 hours with recombinant S1 (1 μg/ml; WT, γ, δ, and β), S1 + S2 (WT), and E (WT) proteins, and the mRNA levels of the indicated genes analyzed by RT-qPCR. S1WT from Sino Biological (S1WT) and ABclonal (S1WT-2) were used. As a control, recombinant E protein was used preheated at 80°C for 30 min (E80). Data are shown as the means ± SEM of three technical replicates from two (A and B) or one (C) donors. P values were calculated using one-way ANOVA, followed by Tukey multiple range test. *P ≤ 0.05, **P ≤ 0.01, and ***P ≤ 0.001.

Fig. 9. Model showing the differential activities of the S protein of SARS-CoV-2 VOCs.
S1 proteins promote neutrophil and macrophage recruitment, local and systemic hyperinflammation, emergency myelopoiesis, and hemorrhages. Inhibition of Ace2 exacerbates all these effects, while inhibition of the inflammasome with the caspase-1 inhibitor VX-765 or Ang (1-7) treatment alleviates them. S1γ was more proinflammatory, while S1δ was less proinflammatory than S1WT, and S1β promoted delayed and long-lasting inflammation.

Acknowledgments
This image is the copyrighted work of the attributed author or publisher, and ZFIN has permission only to display this image to its users. Additional permissions should be obtained from the applicable author or publisher of the image. Full text @ Sci Adv