
- Title
-
Noninvasive visualization of electrical conductivity in tissues at the micrometer scale
- Authors
- Huang, Y., Omar, M., Tian, W., Lopez-Schier, H., Westmeyer, G.G., Chmyrov, A., Sergiadis, G., Ntziachristos, V.
- Source
- Full text @ Sci Adv
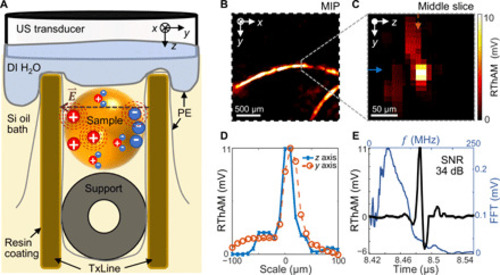
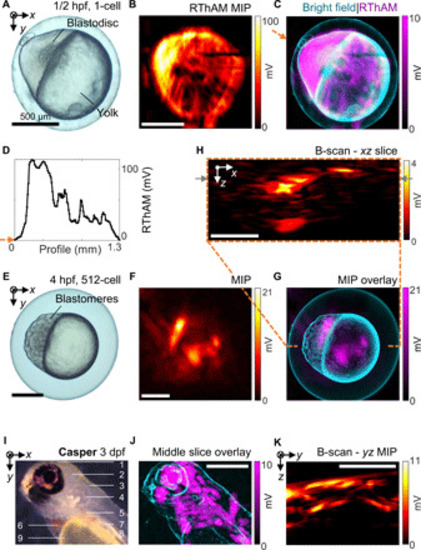
( |
( |