|
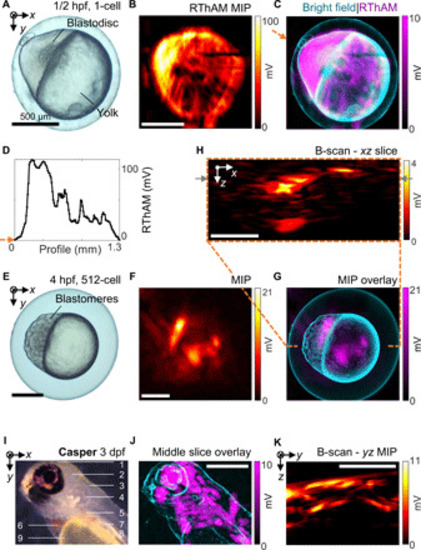
RThAM imaging of developmental zebrafish embryos and larvae.(A to D) Imaging of a one-cell stage embryo (1/2 hpf). (A) Bright-field microphotograph. (B) RThAM MIP image. (C) An overlay of RThAM MIP onto the microphotograph. (D) The profile along the arrow in (C) showing dominant RF absorption in the blastodisc versus the yolk. (E to H) Imaging of a 512-cell stage embryo (4 hpf). (E) Bright field. (F) RThAM MIP. (G) Overlay. (H) An xz-plane B-scan along the dashed orange line in (G), showing intense absorption from the blastomere region and the absorption originated from the surface of the embryo. The gray arrows indicate the B-scan analyzed in fig. S4. (I to K) Imaging of a transparent Casper zebrafish larva at 3 dpf. (I) Optical reflection-mode microphotograph of the larva in the coronal view with annotation of major anatomical features: (1) forebrain; (2) midbrain; (3) hindbrain; (4) inner ear; (5) liver, intestine, and pancreas; (6) heart; (7) swim bladder; (8) spinal cord and vessels/muscles in the trunk; and (9) yolk sac. (J) An overlay of an RThAM slice (~150 μm in thickness) onto the microphotograph (edge-filtered). (K) MIP in the yz plane. Scale bars, 500 μm.
|