FIGURE SUMMARY
Title

A complex genetic architecture in zebrafish relatives Danio quagga and D. kyathit underlies development of stripes and spots

Authors
McCluskey, B.M., Uji, S., Mancusi, J.L., Postlethwait, J.H., Parichy, D.M.
Source
Full text @ PLoS Genet.

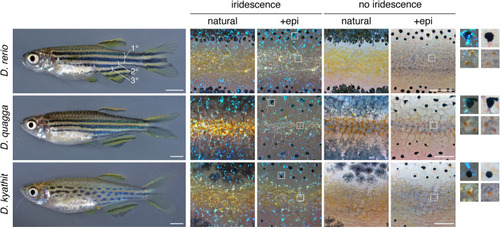
Top, Striped pattern of D. rerio showing primary (1°) light interstripe with primary dark stripes dorsally and ventrally. Secondary and tertiary interstripes and stripes are indicated only ventrally. Right, Cells that comprise dark and light pattern elements. Lighting has been adjusted to highlight or eliminate the iridescence of iridophores, and pigment cells are shown both in their natural state and after treatment with epinephrine (epi), which contracts pigment granules of melanophores and xanthophores towards cell centers. Insets at far right show higher magnification views of boxed regions. Dark stripes comprise melanophores with black melanin granules as well as more superficial iridophores that have a bluish iridescence owing to precisely oriented stacks of guanine-containing reflecting platelets (upper insets). Interstripes and interspot regions contain densely packed iridophores with a yellowish hue owing to disordered stacks of reflecting platelets, as well as more superficially located xanthophores, marked by lipid droplets containing yellow–orange carotenoids [6,54]. Middle and Bottom, Striped and spotted patterns of D. quagga and D. kyathit. Cell types present in each species were indistinguishable from those of D. rerio. In older D. kyathit and D. quagga, red pigment cells—erythrophores—were present and especially prominent in males, whereas D. quagga developed fissures and other disruptions in their stripes, especially in females (S1 Fig). Neither of these features occurs in D. rerio and we do not consider them further in this study. Scale bars, 2 mm (left) and 200 μm (right).

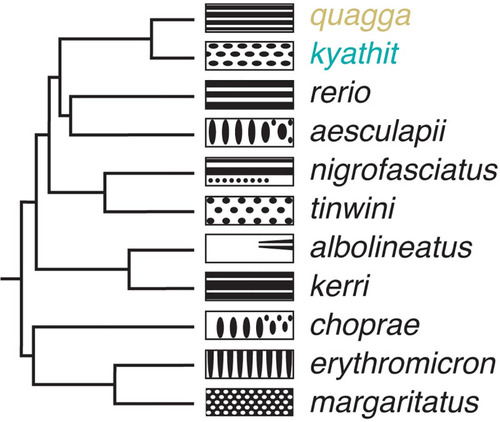
Phylogeny of Danio species, recovered in [16], with schematics illustrating adult melanophore pigment pattern variation (left is anterior). Danio quagga has also been dubbed D. aff. kyathit [16,19,47,49] and individuals likely representing the same species were misidentified originally as D. rerio [97]. Full color images of live fish can be found in [19] (open access); additional images can be found in [4,16].

A morphospace describing pattern variation.

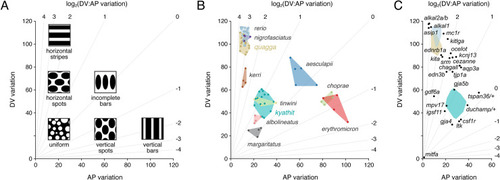
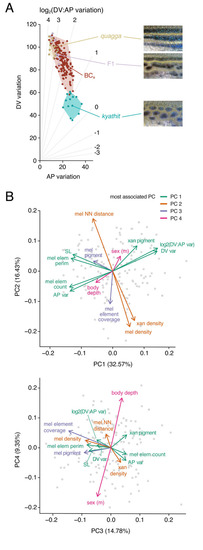
(A) Schematic illustrating where idealized patterns fall in a morphospace defined by DV (dorsoventral) and AP (anteroposterior) pattern variation of melanized elements. Diagonals indicate different log2 values for the ratio of DV variation: AP variation. (B) Mapping of pattern phenotypes in this morphospace revealed overlap of striped D. rerio, D. quagga, and D. nigrofasciatus, and their difference in morphospace from spotted D. kyathit or D. tinwini. Additional species occupied distinct regions of morphospace as well. Images of other Danio species have been published previously [4,16,19]. Points denote individuals and shapes denote observed phenotypic range. (C) Several single locus mutants of D. rerio lie between D. quagga and D. kyathit, or in the vicinity of D. kyathit. These phenotypes arise from null or hypomorphic alleles [22,27, 37,38,42,51,6264,76,85,86,98101], though aqp3a results from an activating mutation [53], and some mutants have yet to be characterized molecularly (cezanne, chagall, duchamp, ocelot) [8,84]. Points for each mutant denote individuals, or averages when images of multiple individuals were available.

Pigment pattern development in <italic>D</italic>. <italic>quagga</italic> and <italic>D</italic>. <italic>kyathit</italic>.

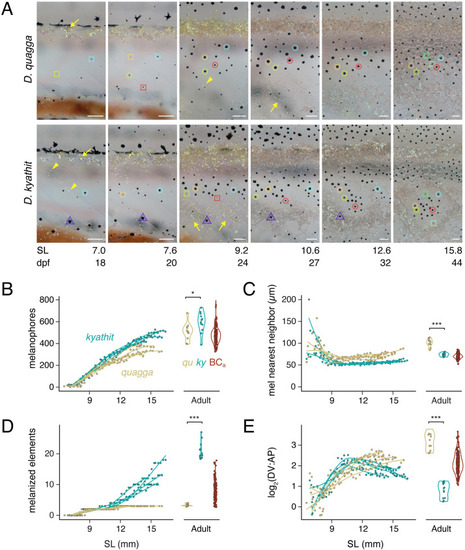
(A) Representative individuals imaged repeatedly during adult pattern formation. Images are aligned to show corresponding regions and rescaled to control for overall growth (frames and regions are selected from S1 Movie). Standard length (SL in mm) serves as a proxy for developmental stage as the relationship between development rate and days post fertilization (dpf) depends on rearing conditions [3]. By 7.0 mm SL, adult melanophores had started to develop in both species. Newly differentiating melanophores are marked by dashed squares, and the same cells are marked by dashed circles of the same color in subsequent images. Adult melanophores ultimately coalesced into dark pattern elements with movements by individual cells and rearrangements among cells particularly apparent in D. kyathit. As in D. rerio, melanophores were occasionally lost in both species (e.g., dashed triangle in D. kyathit) [25,99]. Densely arranged iridophores of the primary interstripe were evident by 7.0 mm SL in both species. Subsequently developing iridophores of stripes or spots (yellow arrowheads) appeared earlier in D. kyathit (7.0 mm SL) than D. quagga (9.2 mm SL), as did iridophores of secondary interstripes or “interspots” further ventrally (yellow arrowheads; 10.6 and 9.2 mm SL, respectively). To facilitate cell counting, fish were treated prior to imaging with epinephrine to contract melanin granules towards cell centers. Images shown are representative of 4 individuals of each species imaged throughout the stages of early adult pigment pattern development. (B–E) Pattern metrics during development of fish imaged repeatedly (splines over points), and in young adults and backcross progeny (most 22–25 mm SL, 4–5 months post-fertilization; see main text and S3 Fig). Individual points for melanophore nearest neighbor distances (C) represent median values calculated for all melanophores examined within each individual fish at time points with ten or more melanophores. *, P = 0.029 in B (F1,21 = 5.52); ***, P<0.0002 in C (F1,21 = 19.83), P<0.0001 in D (F1,21 = 421.04), P<0.0001 in E (F1,21 = 217.11). Scale bars, 100 μm.

Hybrid and backcross progeny phenotypes of <italic>D</italic>. <italic>quagga</italic> and <italic>D</italic>. <italic>kyathit</italic>.

(A) Pattern variation morphospace showing locations of parental D. quagga and D. kyathit, F1 hybrids, and backcross progeny (BCa). Images of D. quagga and D. kyathit patterns are details of the same individuals shown in Fig 2 and the F1 hybrid shows a typical pattern in this cross. (B) Principal components (PC) of phenotypic variation in BCa progeny with percent variance explained noted in parentheses. Melanized element count and perimeter refer to entire spots or stripes. Melanized element coverage refers to total area covered by melanized elements relative to total imaged flank area. Likewise, melanophore and xanthophore densities were calculated relative to total area. Melanophore and xanthophore pigment refer to areas of contracted pigment granules, rather than entire cell sizes. For sex, arrow points towards values typical of males. NN, nearest neighbor.

Chromosomal regions associated with pattern and size metrics in backcross individuals.

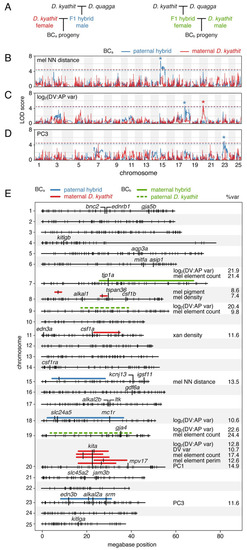
(A) Crossing schemes for mapping variation in two independent families, BCa and BCb (see main text). (B–C) Log odds scores of example QTL (BCa) for melanophore spacing (nearest neighbor distance, log2(DV:AP variation), and number of melanophore elements across 25 chromosomes. Variation segegrating between species in blue and within D. kyathit in red. Dashed lines indicate q = 0.05 false discovery thresholds and asterisks indicate peak LOD scores. (E) Summary of regions associated with pattern variation and size in the same family referenced in B–C (BCa), and defined by FST values for phenotypically extreme individuals from a second family (BCb; see main text). Regions highlighted have peaks (q<0.05, LOD≥4) marked by vertical bars and widths defined by positions 1.5 LOD lower than peaks. Percents of phenotypic variance explained by QTL (%var) are indicated at right. Small, vertical hash marks on chromosomes denote BCa maternal D. kyathit marker loci and positions of several genes having roles in pigment pattern formation in D. rerio are indicated as well.

Epistatic relationships between QTL influence pattern phenotype.

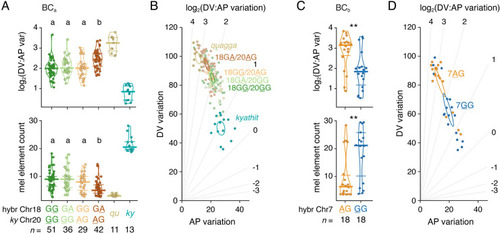
(A) Genotypes at Chr18:5246981 and Chr20:23025453 linked to variants affecting log2(DV:AP variation) and melanophore element count in BCa progeny. Genotypes are listed as maternally-inherited D. kyathit allele followed by paternally inherited allele with phenotype-associated alleles underlined. Bars indicate medians ± interquartile range. Overall analyses of variance for allelic combinations in BCa progeny: upper, F3,154 = 7.26, P<0.0001; lower, F3,154 = 10.07, P<0.0001). Means not significantly different from one another (P>0.05) in post hoc Tukey-Kramer comparisons are indicated by shared letters above data points. (B) Three combinations of Chr18 and Chr20 alleles overlapped in morphospace. When striped alleles on Chr18 and Chr20 were together, a phenotype significantly more similar to that of D. quagga developed. Ellipses indicate 95% confidence intervals of means. (C) Genotype at Chr7:27412951 impacts log2(DV:AP variation) and melanophore element count in BCb progeny selected for striped and spotted phenotypes. Analyses of variance: left, F1,34 = 9.30, P = 0.0044; lower, F1,34 = 8.91, P = 0.0052. (D) Morphospace position was impacted by variants linked to maternally inherited D. kyathit alleles at Chr7:27412951. Most siblings with the A allele had patterns similar to D. quagga whereas progeny with the G allele were more similar to D. kyathit. (compare with representative parental species values in A). Statistical analyses in A and C used DV:AP variation and ln(melanophore elements), which stabilized among-group differences in residual variance evident in original values.

Acknowledgments
This image is the copyrighted work of the attributed author or publisher, and ZFIN has permission only to display this image to its users. Additional permissions should be obtained from the applicable author or publisher of the image. Full text @ PLoS Genet.