IMAGE

Fig 6

ID
ZDB-IMAGE-210519-55
Source
Figures for McCluskey et al., 2021
Image
Figure Caption

Fig 6 Chromosomal regions associated with pattern and size metrics in backcross individuals.

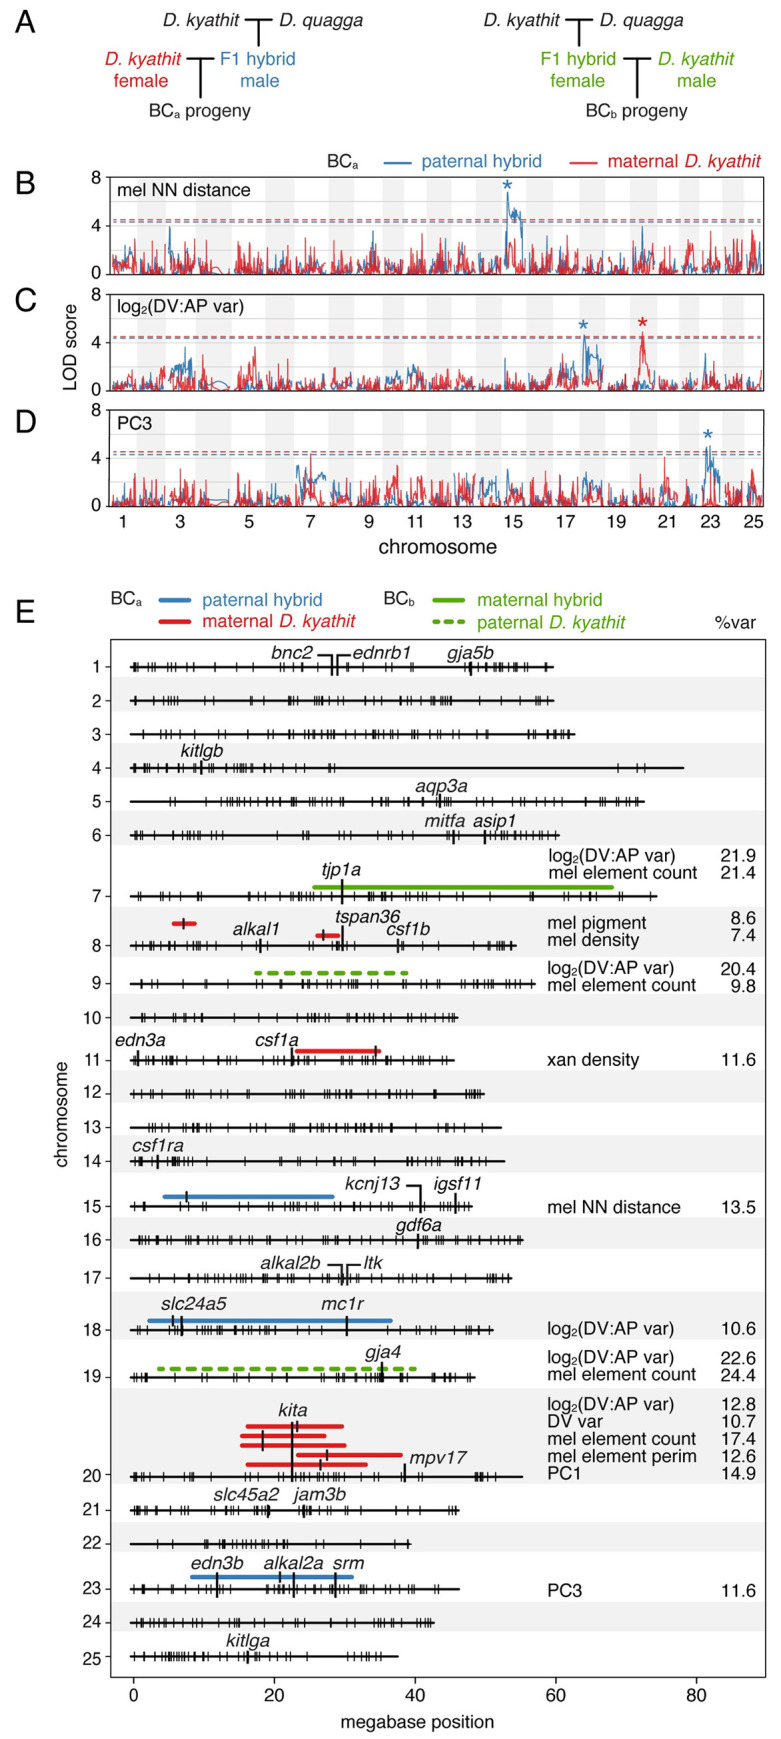
(A) Crossing schemes for mapping variation in two independent families, BCa and BCb (see main text). (B–C) Log odds scores of example QTL (BCa) for melanophore spacing (nearest neighbor distance, log2(DV:AP variation), and number of melanophore elements across 25 chromosomes. Variation segegrating between species in blue and within D. kyathit in red. Dashed lines indicate q = 0.05 false discovery thresholds and asterisks indicate peak LOD scores. (E) Summary of regions associated with pattern variation and size in the same family referenced in B–C (BCa), and defined by FST values for phenotypically extreme individuals from a second family (BCb; see main text). Regions highlighted have peaks (q<0.05, LOD≥4) marked by vertical bars and widths defined by positions 1.5 LOD lower than peaks. Percents of phenotypic variance explained by QTL (%var) are indicated at right. Small, vertical hash marks on chromosomes denote BCa maternal D. kyathit marker loci and positions of several genes having roles in pigment pattern formation in D. rerio are indicated as well.

Acknowledgments
This image is the copyrighted work of the attributed author or publisher, and ZFIN has permission only to display this image to its users. Additional permissions should be obtained from the applicable author or publisher of the image. Full text @ PLoS Genet.