
- Title
-
Kcnb1 plays a role in development of the inner ear
- Authors
- Jedrychowska, J., Gasanov, E.V., Korzh, V.
- Source
- Full text @ Dev. Biol.
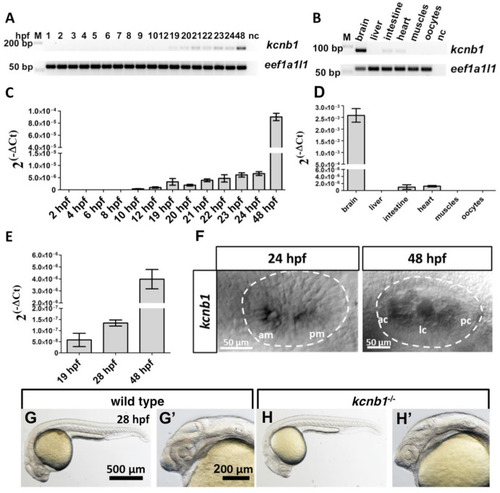
Fig. 1. kcnb1 developmental expression profile and overall phenotype of kcnb1−/− at 28 hpf. (A, C) Expression of kcnb1 starts increasing at 19 hpf. (B, D) In adults, kcnb1 strongly expressed in the brain, and weakly in the heart and intestine. (E, F) Expression of kcnb1 in the developing otic vesicle analyzed by qRT-PCR (E) and in situ hybridization (F). (G-H′) Phenotype of kcnb1−/− compared with wildtype control embryo at 24 hpf. The mutant exhibits a small brain ventricular system and small otic vesicles. (C–E) qRT-PCR. The data are expressed as expression levels ± SD, calculated using the 2-ΔΔCt method and normalized to eef1a1l1 (n = 3–6). ac, anterior crista; am, anterior macula; bp, base pairs; hpf, hours post fertilization; lc, lateral crista; M, mass marker; nc, negative control; pc, posterior crista; pm, posterior macula. |
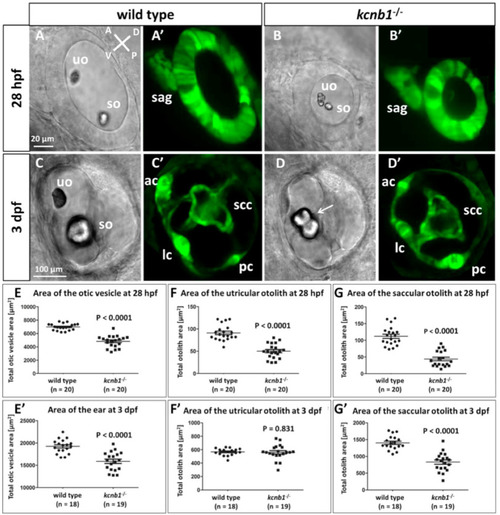
Fig. 2. Mutation of kcnb1 causes defects in the developing ear. At 28 hpf (A, B) and 3 dpf (C, D) kcnb1−/− mutants develop smaller ears and otoliths compared with wildtype controls. Fused otoliths in mutant ears at 3 dpf are shown (arrow). A′-D′, The ET33-mi2A transgenic line was used as a background to characterize inner ear morphology. Mutants developed all main elements of the inner ear despite the small size of mutant ears. E-G’’ Morphometric analysis of the size of the ears and otoliths at 28 hpf and 3 dpf. Both otoliths were small in 28 hpf mutants compared with the wildtype controls. By 3 dpf, the utricular otolith reached the same size as in wildtype controls, unlike the saccular otolith, which remained small. Data are expressed as mean ± SEM, unpaired Student’s t-test. Imaging was performed using light-sheet fluorescence microscopy (20 × objective). ac, anterior crista; dpf, days post fertilization; hpf, hours post fertilization; lc, lateral crista; pc, posterior crista; sag, VIII statoacoustic ganglion; scc, semicircular canals; so, saccular otolith; uo, utricular otolith. |
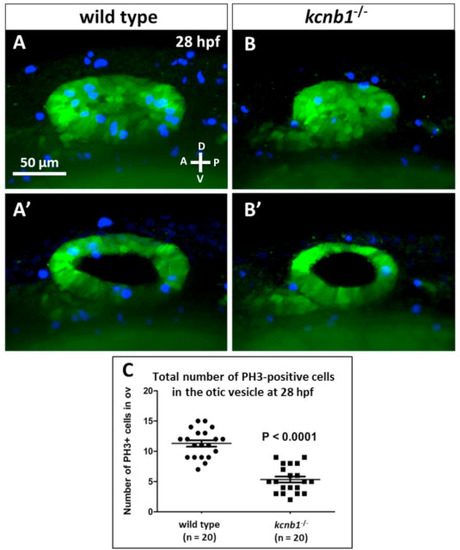
Fig. 3. Cell proliferation is low in the kcnb1−/− otic vesicle at 28 hpf . (A, B) Maximum intensity projections of z-stacks that represent the otic vesicle at 28 hpf in the wildtype controls (A) and kcnb1−/− mutant (B). (A′, B′) Optical cross-sections of the otic vesicles. (C) Total number of PH3-positive cells in the mutant’s otic vesicles was low at 28 hpf. Imaging was performend using light-sheet fluorescence microscopy (40 objective). Staining: green (anti-GFP), blue (anti-phospho-histone 3). The ET33-mi2A zebrafish line was used as a transgenic background. The data are expressed as mean SEM (unpaired Student’s t-test). |
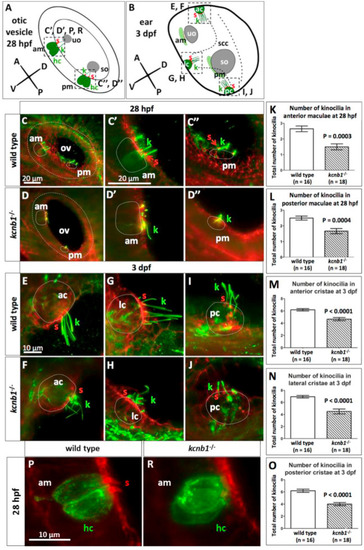
Fig. 4. The orientation of kcnb1−/− tether cell kinocilia is abnormal. (A, B) Schematic representation of the otic vesicle at 28 hpf (A) and ear at 3 dpf (B). (C, D) Lateral view of the otic vesicles at 28 hpf. (C′, D′, C″, D″) Magnification of anterior maculae (C′, D′) and posterior maculae (C″, D″). kcnb1−/− kinocilia (green) are oriented abnormally. (K, L) Number of kcnb1−/− kinocilia in anterior and posterior maculae at 28 hpf was lower compared with wildtype control. (E, F) Magnification of anterior cristae at 3 dpf, (G, H) Lateral cristae at 3 dpf, (I, J) Posterior cristae at 3 dpf. (F, H, J) kcnb1−/− kinocilia formed abnormally oriented “looped strings”. (M–O) At 3 dpf, the number of kinocilia in anterior, lateral and posterior cristae was lower compared with wildtype controls. (P–R) In mutants, hair cells were present, but stereocilia were not detected. Imaging was performed using light-sheet fluorescence microscopy with a 63 objective (C, D00) and 40 objective (E-J, P-R). Staining: green (anti-acetylated tubulin), red (phalloidin) in (C-J), green (antiotoferlin) and red (phalloidin) in (P-R). Data are expressed as mean SEM (unpaired Student’s t-test). ac, anterior crista; am, anterior macula; dpf, days post fertilization; hc, hair cell; hpf, hours post fertilization; k, kinocilium; lc, lateral crista; ov, otic vesicle; pc, posterior crista; pm, posterior macula; s, stereocilia; scc, semicircular canals; so, saccular otolith; uo, utricular otolith. |
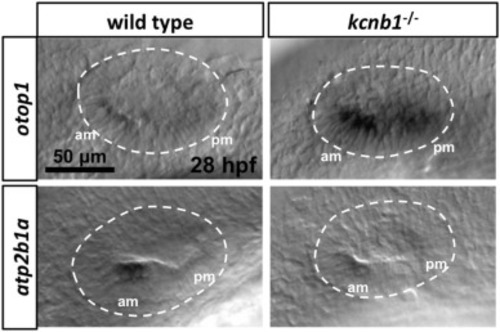
Fig. 5. Changes in the expression of otop1 and atp2b1a in kcnb1−/− embryos at 28 hpf. otop expression was higher, and atp2b1a expression lower in mutants than in the wildtype controls. Outlines of the otic vesicles are marked with a dotted line. |
Reprinted from Developmental Biology, 471, Jedrychowska, J., Gasanov, E.V., Korzh, V., Kcnb1 plays a role in development of the inner ear, 65-75, Copyright (2020) with permission from Elsevier. Full text @ Dev. Biol.