
|
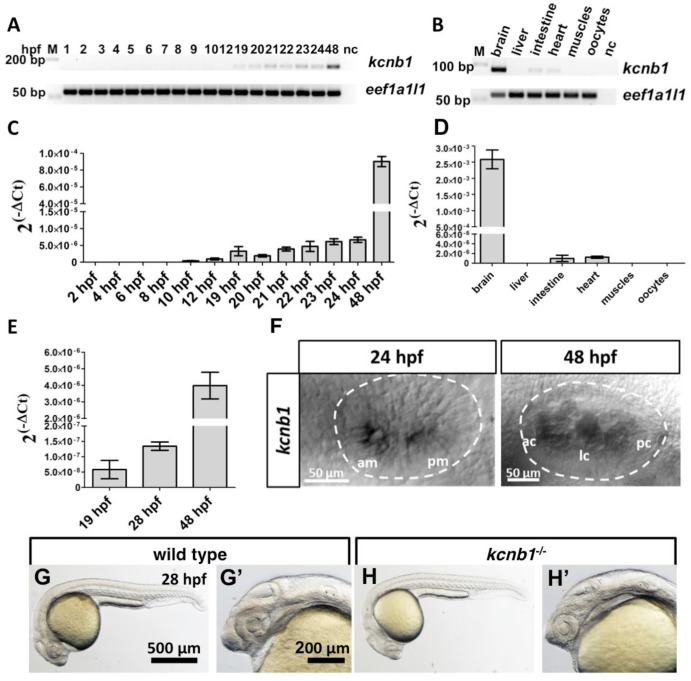
Fig. 1 Fig. 1. kcnb1 developmental expression profile and overall phenotype of kcnb1−/− at 28 hpf. (A, C) Expression of kcnb1 starts increasing at 19 hpf. (B, D) In adults, kcnb1 strongly expressed in the brain, and weakly in the heart and intestine. (E, F) Expression of kcnb1 in the developing otic vesicle analyzed by qRT-PCR (E) and in situ hybridization (F). (G-H′) Phenotype of kcnb1−/− compared with wildtype control embryo at 24 hpf. The mutant exhibits a small brain ventricular system and small otic vesicles. (C–E) qRT-PCR. The data are expressed as expression levels ± SD, calculated using the 2-ΔΔCt method and normalized to eef1a1l1 (n = 3–6). ac, anterior crista; am, anterior macula; bp, base pairs; hpf, hours post fertilization; lc, lateral crista; M, mass marker; nc, negative control; pc, posterior crista; pm, posterior macula.
Reprinted from Developmental Biology, 471, Jedrychowska, J., Gasanov, E.V., Korzh, V., Kcnb1 plays a role in development of the inner ear, 65-75, Copyright (2020) with permission from Elsevier. Full text @ Dev. Biol.