FIGURE SUMMARY
Title

Zebrafish: A Resourceful Vertebrate Model to Investigate Skeletal Disorders

Authors
Tonelli, F., Bek, J.W., Besio, R., De Clercq, A., Leoni, L., Salmon, P., Coucke, P.J., Willaert, A., Forlino, A.
Source
Full text @ Front Endocrinol (Lausanne)

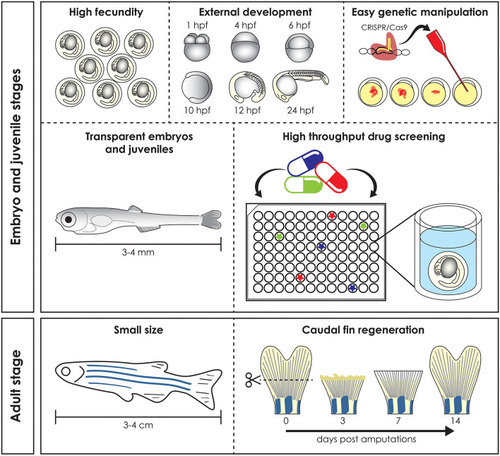
Advantages of the zebrafish model. Zebrafish has several advantages compared to mammal models. High fecundity and external fertilization and development allow easy genomic manipulation, transparent early life stages guarantee in vivo imaging and skin permeability makes them suitable for high throughput drug screening (top). Adult zebrafish reaches a maximum size of 3–4 cm and this make it easy and cheap to keep it in large numbers, reducing the husbandry cost (bottom left). Finally, zebrafish is used as a vertebrate model to study regeneration, due to its ability to regenerate different organs, such as the caudal fin, which is completely regenerated 14 days post amputation (bottom right). hpf, hours post fertilization.

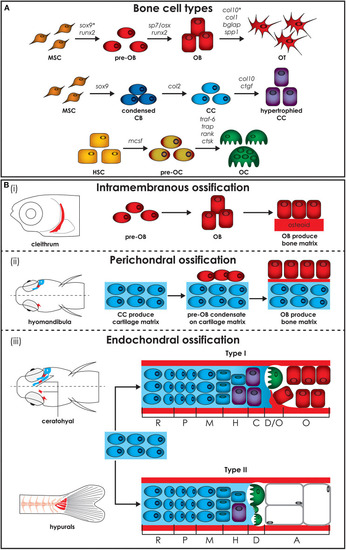
Zebrafish bone cells and ossification types. (A) Bone is formed by osteoblasts and osteocytes, while cartilage is formed by chondroblasts and chondrocytes, and both bone and cartilage are degraded by osteoclasts. All bone cell types develop from progenitors similar to the mammalian counterpart and share similar gene expression profiles (genes are indicated above arrows). Note however that HSCs in zebrafish are not present in the bone marrow but in the head kidney. In addition, the genes for collagen X, encoded by col10, and SRY-box transcription factor 9 (indicated by*), encoded by sox9, are expressed during osteoblasts differentiation in zebrafish, but not in humans. (B) Three types of ossification are present in zebrafish: (i) intramembranous ossification, (ii) perichondral ossification, present in teleosts but not in humans, and (iii) endochondral ossification. (i) During intramembranous ossification mesenchymal stem cells condensate and differentiate into pre-osteoblasts and finally into mature osteoblasts that deposit bone matrix (osteoid) that subsequently mineralizes. (ii) Perichondral ossification starts at the surface of a cartilaginous template where osteoblasts deposit bone matrix without replacing the cartilage. (iii) Endochondral ossification is the process by which growing cartilage is replaced by bone to allow the skeleton to grow. For ossification to start, matrix surrounding the chondrocytes must calcify so that osteoclasts can break down the cartilage. In teleost two types of endochondral ossification exist. Type I endochondral ossification, typical in the ceratohyal, resembles the mammalian endochondral ossification process. This is characterized by a hypertrophic zone, where the cartilage matrix calcifies, followed by a degradation zone where osteoclasts (also referred to as chondroclasts) degrade the cartilaginous matrix, and a bone formation zone. Type II ossification, in the hypurals, is characterized by a lack of the calcification and ossification zones, leading to tubular concave bones filled with adipose tissue. Schematics based on detail description in Weigele and Franz-Odendaal (36). A, adipose zone; C, calcification zone; CB, chondroblasts; CC, chondrocytes; D, degradation zone; H, hypertrophic zone; HSC, hematopoietic stem cell; M, maturation zone; MSC, mesenchymal stem cell; O, ossification zone; OB, osteoblasts; OC, osteoclasts; OT, osteocytes; P, proliferation zone; R, rest zone.

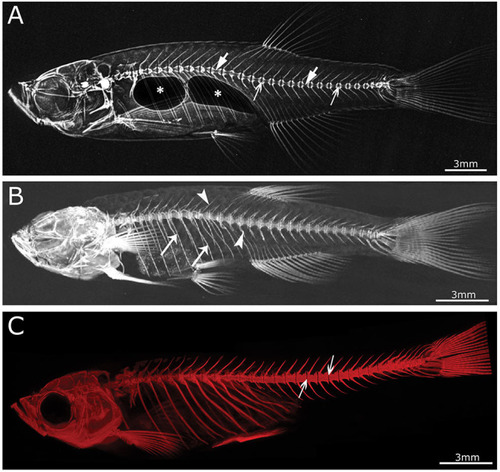
Imaging techniques in zebrafish. (A) Lateral x-ray image of a wild type zebrafish acquired with a Faxitron tabletop X-ray cabinet. Notice the outline of the major bones in the skull and vertebral column and the outline of the double chambered swim bladder (indicated by asterisks) in the abdominal cavity. The tissue inside the vertebrae (indicated by block arrows) and intervertebral spaces (indicated by line arrows), i.e., the notochord, can be easily assessed for the presence of mineral. (B) Lateral view of a 3D reconstructed microCT scanned adult zebrafish at 21 μm. More details are visible in the skull and especially the vertebral column compared to the x-ray image (neural and haemal arch are indicated by arrow heads and the ribs with a small arrows). (C) Lateral image in the fluorescent channel of a zebrafish whole mount cleared and stained with alizarin red for mineralized tissues. Compared to the images above, more details of the skeleton can be observed, especially in the vertebral column where all individual bones and their outlines can be noticed. The alizarin red image also allows to assess the presence of mineral in the intervertebral space (indicated by arrows). All images were taken of wild type zebrafish.

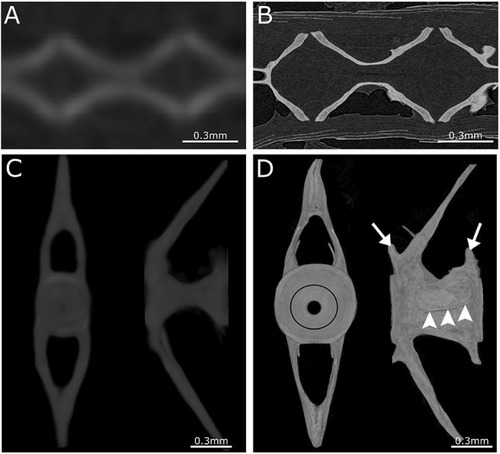
Comparison between low- and high-resolution microCT. (A) Image of parasagittal microCT plane at 21 μm. (B) Similar structure as in (A) but scanned at 0.75 μm. Comparison between low-resolution and high-resolution microCT clearly demonstrates the ability to distinguish separate vertebrae and compact bone only using high-resolution microCT. (C) Anterior and lateral view of a 3D maximal projection surface render of a vertebrae scanned at 21 μm. (D) Similar structure as in (C) but scanned at 0.75 μm. Notice the difference in detail where the growth rings (black circle) are visible in the vertebral endplate on the anterior view. The lateral view of high-resolution microCT shows the outline of the vertebra with the pre- and post-zygapophyses (white arrows), and an antero-posterior running medial vertebral trabecula (white arrowheads).

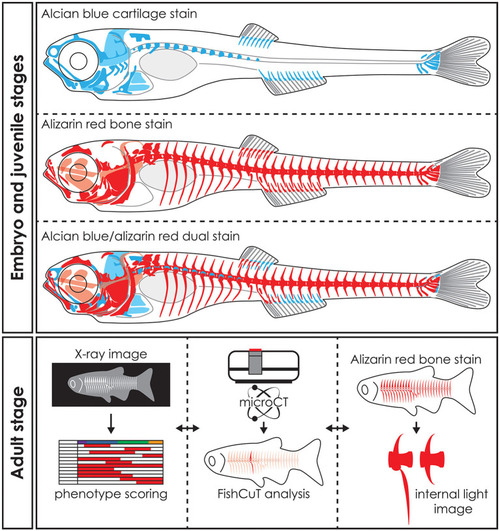
Whole mount staining in early stages and applications of visualization techniques in adult zebrafish. Schematic representation of whole mount cleared and stained early stage zebrafish for cartilage with alcian blue, mineralized tissues (bone) with alizarin red and dual stained for both cartilage and mineralized tissues. Notice that only part of the skull, the basiventrals [for definition see Gadow and Abbott (243)] of the abdominal vertebrae and the fins endoskeleton are pre-formed in cartilage. Many bones in the skull and especially in the vertebral column are formed by direct intramembranous ossification. Images of adult skeletons taken by x-ray can be used to score for skeletal abnormalities, while microCT data can be used in an analysis program such as FishCuT to obtain quantitative data of bone measurements such as size, volume, thickness, and bone mineral density (80, 120). Bright field images or fluorescent images of whole mount cleared and stained zebrafish for mineralized tissues with alizarin red can be used to study skeletal abnormalities in detail. The three techniques are mostly used on euthanized and fixed specimens and thus can be applied on the same specimen sequentially. Moreover, the data procured by these visualization techniques can be integrated into a large data matrix and allows detailed phenotypic descriptions of zebrafish disease models.

Acknowledgments
This image is the copyrighted work of the attributed author or publisher, and ZFIN has permission only to display this image to its users. Additional permissions should be obtained from the applicable author or publisher of the image. Full text @ Front Endocrinol (Lausanne)