FIGURE

Figure 4

ID
ZDB-FIG-200829-62
Publication
Tonelli et al., 2020 - Zebrafish: A Resourceful Vertebrate Model to Investigate Skeletal Disorders
Other Figures
All Figure Page
Back to All Figure Page
Figure 4

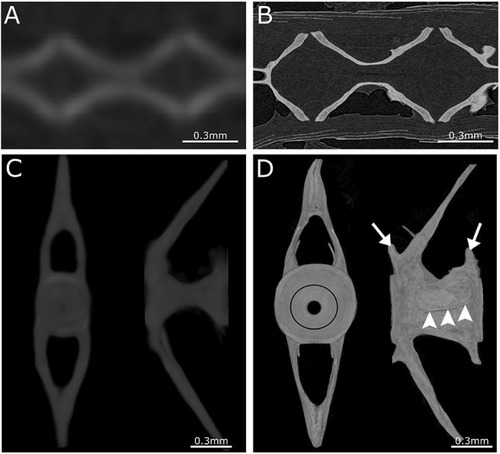
Comparison between low- and high-resolution microCT. (A) Image of parasagittal microCT plane at 21 μm. (B) Similar structure as in (A) but scanned at 0.75 μm. Comparison between low-resolution and high-resolution microCT clearly demonstrates the ability to distinguish separate vertebrae and compact bone only using high-resolution microCT. (C) Anterior and lateral view of a 3D maximal projection surface render of a vertebrae scanned at 21 μm. (D) Similar structure as in (C) but scanned at 0.75 μm. Notice the difference in detail where the growth rings (black circle) are visible in the vertebral endplate on the anterior view. The lateral view of high-resolution microCT shows the outline of the vertebra with the pre- and post-zygapophyses (white arrows), and an antero-posterior running medial vertebral trabecula (white arrowheads).

Expression Data

Expression Detail
Antibody Labeling
Phenotype Data

Phenotype Detail
Acknowledgments
This image is the copyrighted work of the attributed author or publisher, and ZFIN has permission only to display this image to its users. Additional permissions should be obtained from the applicable author or publisher of the image. Full text @ Front Endocrinol (Lausanne)