
- Title
-
MicroRNAs Establish the Right-Handed Dominance of the Heart Laterality Pathway in Vertebrates
- Authors
- Rago, L., Castroviejo, N., Fazilaty, H., Garcia-Asencio, F., Ocaña, O.H., Galcerán, J., Nieto, M.A.
- Source
- Full text @ Dev. Cell
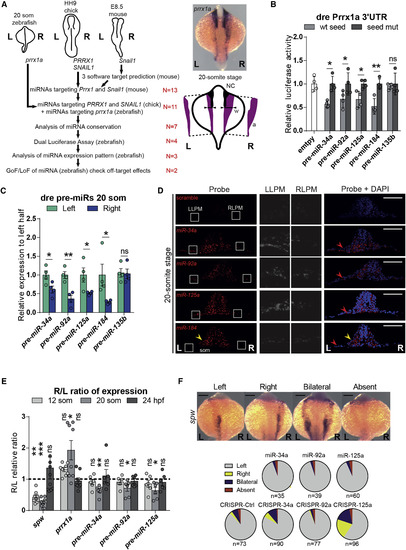
miRNAs Predicted to Bind to Right-Handed EMT-TFs 3′ UTRs Are Asymmetrically Expressed in the Same Time Window than prrx1a in Zebrafish Embryos and Are Able to Downregulate Reporter Expression (A) Strategy to obtain vertebrate-conserved miRNAs able to regulate right-handed pathway EMT-TFs. A diagram of the species used is shown, with each EMT-TFs and the developmental time point where their asymmetric expression is evident by in situ hybridization. (L) Left; (R) Right; N = number of miRNAs selected (see also Figure S1A). prrx1a expression at the 20-somite stage, showing L/R asymmetric levels. The diagram below exemplifies the measurement of area and width of the ISH signal used in this manuscript. NC, Neural Crest positive signal was omitted for area calculation; a, resulting left and right areas measured; w, width of the signal indicated by arrows used for left and right LPM. (B) Luciferase reporter assay shows interaction of miR-34a, miR-92a, miR-125a, and miR-184 with zebrafish prrx1a 3′ UTR. miR-135b is not able to downregulate reporter expression. Data represent mean ± SEM, ∗ p < 0.05, ∗∗ p < 0.01, ns = not significant, two-sided Student’s t test WT seed versus seed mut, n = 4 independent experiments. (C) Four pre-miRNAs show higher expression on the left half at the 20-somite stage. Zebrafish embryos were collected and dissected right and left halves were pooled for total RNA isolation. qPCR for the indicated pre-miRNAs was performed and relative amounts were normalized to the left halves. Data represent mean ± SEM, ∗ p < 0.05, ∗∗ p < 0.01, two-sided Student’s t test left versus right halves, n = 4 independent pools of 8 halves per pool. (D) In situ hybridization for mature miRNAs in 20-somite stage zebrafish embryos show higher levels of three miRNAs in the left LPM (LLPM) compared to the right LPM (RLPM). Zebrafish embryos were collected at 20-somite stage and cryosections of 10 μm were subjected to ISH using LNA double-DIG specific probes. Left (L) and right (R) sides are indicated on the picture. White box insets are magnified for comparison of LLPM versus RLPM. The asymmetric expression for miR-184 is apparent in the somitic mesoderm (som, yellow arrowhead) but not in the LPM (white box insets, read arrowheads). Detection of nuclei with DAPI (right panels) allows the localization of the different territories, LPM, som and neural tube. Scale bar: 250 μm. (E) pre-miRNAs asymmetric expression is transient. We collected 6 independent pools (8 embryo halves per pool), performed qPCR for each developmental stage (12- or 20-somite stages and 24 h post-fertilization), and calculated the R/L ratio of the normalized (to left halves) levels for prrx1a, pre-miR-34a, pre-miR-92a, and pre-miR-125a. We used spw levels as an internal control (Hirokawa et al., 2006). A value of 1 (dotted line) indicates bilaterally symmetric expression. Note that prrx1a and pre-miRNAs R/L ratio deviates from 1 only at 20-somite stage. Data represent mean of R/L ratio ± SEM, ∗ p < 0.05, ∗∗ p < 0.01, ∗∗∗ p < 0.001, two-sided Student’s t test left versus right halves, n = 6 independent pools of 8 halves/pool. (F) Zebrafish embryos were injected with synthetic miRNAs or with Cas9 alone (CRISPR-Ctrl) or with specific sgRNAs targeting miRNA sequences. Embryos collected at 20-somite stage were subjected to ISH for spw expression and its laterality quantified. Only miR-125a knockout affects the normal spw expression pattern. Scale bar: 250 μm. See also Figure S1. |
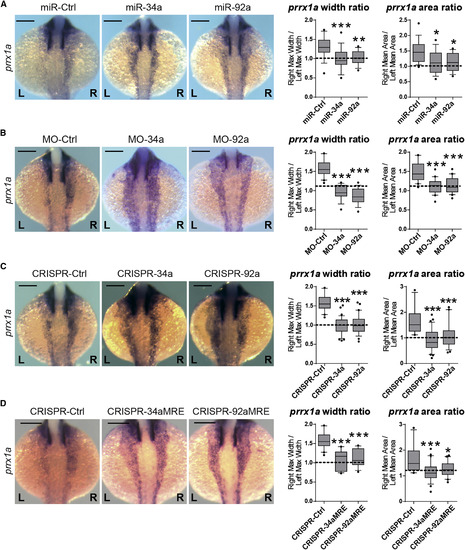
miRNAs Regulate prrx1a Asymmetric Levels at the 20-Somite Stage Zebrafish embryos were injected with synthesized miRNAs, specific MOs, or sgRNAs targeting each miRNA sequence at 1- to 2-cell stage and collected at the 20-somite stage (A) miRNA gain-of-function analysis. Representative pictures of prrx1a expression in embryos injected with miR-135b-mut (miR-Ctrl), miR-34a or miR-92a. Quantification of width and area of prrx1a signal, represented as R/L ratio. A ratio of 1 (dotted line) indicates L/R bilateral symmetry. Data represent interquartile distribution with 10–90 percentile, ∗ p < 0.05, ∗∗ p < 0.01, ∗∗∗ p < 0.001, ANOVA with Dunnett’s multiple comparison test treatments versus miR-Ctrl, n = 16–19 embryos per condition. (B) miRNA downregulation analysis. Representative pictures of prrx1a expression in embryos injected with MO-Ctrl, or specific MOs for miR-34a (MO-34a) and miR-92a (MO-92a). Quantification of prrx1a signal width and area was performed as before. Data represent interquartile distribution with 10–90 percentile, ∗∗∗p < 0.001, ANOVA with Dunnett’s multiple comparison test treatments versus MO-Ctrl, n = 20 embryos per condition. (C) Representative pictures of prrx1a expression in embryos injected with Cas9 alone (CRISPR-Ctrl) or sgRNAs targeting either miR-34a (CRISPR-34a) or miR-92a (CRISPR-92a). The quantification of L/R areas and width were calculated as before. Data represent interquartile distribution with 10–90 percentile, ∗∗∗ p < 0.001, ANOVA with Dunnett’s multiple comparison test treatments versus CRISPR-Ctrl, n = 20–40 embryos per condition. (D) Zebrafish embryos were injected with sgRNAs targeting the predicted binding sites for miR-34a (CRISPR-34aMRE) or miR-92a (CRISPR-92aMRE) within the prrx1a 3′ UTR. Examples of the phenotypes observed at 20-somite stage, compared to a control (CRISPR-Ctrl; only Cas9 injected). Quantification of width and area of signal ratio of prrx1a in injected embryos. Data represent interquartile distribution with 10–90 percentile, ∗ p < 0.05, ∗∗∗ p < 0.001, ANOVA with Dunnett’s multiple comparison test CRISPR-MRE versus. CRISPR-Ctrl, n = 17–25 embryos per condition. Scale bar: 250 μm. See also Figure S2. |
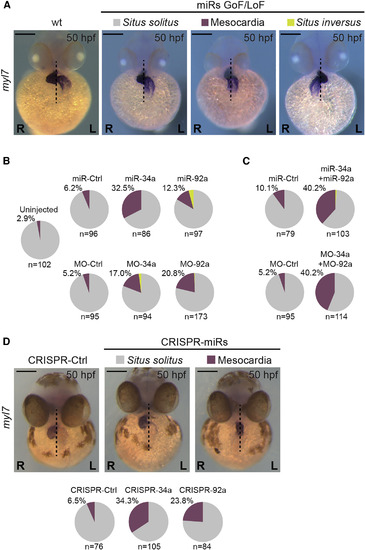
miRNAs Regulate Heart Positioning Zebrafish embryos were injected with synthesized miRNAs or MOs at 1–2 cell stage and collected at at 50 hpf to assess heart laterality. (A) After in situ hybridization for myl7 (cardiac myosin light chain 7) embryos were classified into three phenotypes: Situs solitus (normal condition, right heart looping after displacement of the posterior pole to the left), Mesocardia (heart in the middle), or Situs inversus (left heart looping after displacement of the posterior pole to the right). WT condition shows Situs solitus. (B) Pie charts represent the percentage of left/right displacement of the posterior pole from the midline or mesocardia found after miRNAs GoF (miR−) or downregulation (MO−). (C) Similar pie charts obtained after simultaneous GoF (upper) or knocking down (lower) of miR-34a and miR-92a. (D) Embryos injected at 1–2 cell stage with sgRNAs targeting the miRNA sequences analyzed at 50 hpf to assess heart laterality. Only normal position (Situs solitus) and mesocardia were observed. Percentage of mesocardia and number of embryos (n) is noted. (L), left; (R) right sides. Scale bar: 250 μm. See also Figure S3. |
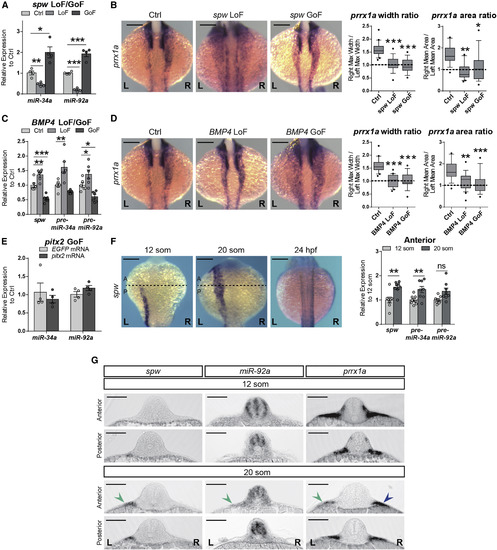
miRNA Expression Is Regulated by Nodal Wave (A) Zebrafish one-cell stage embryos were injected with southpaw mRNA (spw, GoF), spw-morpholino (LoF) or control MO (Ctrl), and were collected at 20-somite stage. Levels of mature miRNA expression are normalized to those in Ctrl. Data represent mean ± SEM, ∗ p < 0.05, ∗∗ p < 0.01, ∗∗∗ p < 0.001, ANOVA with Dunnett’s multiple comparison test GoF or LoF versus Ctrl, n = 4 independent experiments. (B) Representative embryos showing prrx1a expression after spw loss or gain of function (LoF and GoF, respectively) and quantification of R/L ratio of width and area of the signal. Data represent interquartile distribution with 10–90 percentile, ∗ p < 0.05, ∗∗ p < 0.01, ∗∗∗ p < 0.001, ANOVA with Dunnett’s multiple comparison test GoF or LoF versus Ctrl, n = 15–19 embryos per condition. Scale bar: 250 μm. (C) Zebrafish one-cell stage embryos were injected with BMP4 mRNAs or specific MO and analyzed at the 20-somite stage. Levels of spw and pre-miRNAs after BMP4 GoF or knockdown (LoF) were compared to a control (MO-Ctrl for LoF, EGFP mRNA for GoF). Data represent mean ± SEM, ∗ p < 0.05, ∗∗ p < 0.01, ∗∗∗ p < 0.001, ANOVA with Dunnett’s multiple comparison test GoF or LoF versus Ctrl, n = 6 independent experiments. (D) prrx1a expression upon BMP4 LoF/GoF and quantification of R/L ratios. Data represent mean ± SEM, ∗∗ p < 0.01, ∗∗∗ p < 0.001, ANOVA with Dunnett’s multiple comparison test GoF or LoF versus Ctrl, n = 15–19 embryos per condition. Scale bar: 250 μm. (E) Zebrafish embryos were injected at one-cell stage with EGFP mRNA (Ctrl) or pitx2a mRNA (pitx2 GoF), and embryos collected at 20-somite stage for qPCR. Mature miRNAs levels are normalized to Ctrl. Data represent mean ± SEM, n = 4 independent experiments. (F) In situ hybridization for spw at different stages. The dotted lines indicate the level of dissection to isolate anterior and posterior halves in embryos at the same stages. Four pools of 6–8 embryos were collected and analyzed for transcript levels. Graphs show relative levels of spw and pre-miRNAs transcripts normalized to those at the 12-somite stage. Data represent mean ± SEM, ∗∗ p < 0.01, ns = not significant, two-sided Student’s t test 12 som versus 20 som, n = 4 independent pools of 6–8 halves per pool. (G) Transverse sections taken at anterior and posterior levels of 12- and 20-somite stage zebrafish embryos hybridized with spw, prrx1a, and miR-92a probes. spw and miR-92a are detected on the anterior-left LPM only at the 20-somite stage and concomitant with a decrease in prrx1a expression (green arrowheads). Compare prrx1a levels between left and right sides (green and blue arrowheads, respectively). Scale bar: 250 μm. See also Figure S4. |
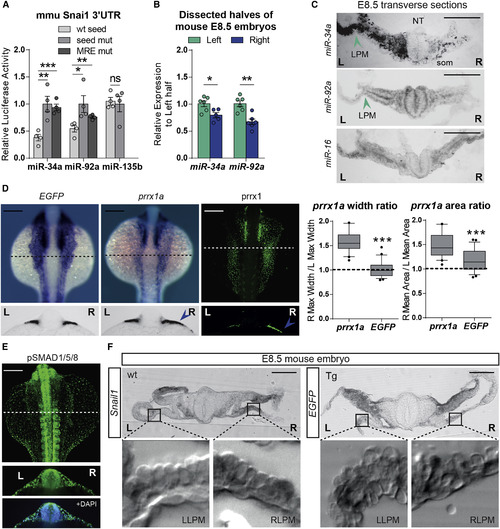
miRNAs Establish the Right-Handed Dominance of the BMP Pathway Leading to Heart Laterality in Vertebrates (A) Luciferase reporter assay for the mouse Snail1 3′UTR in the presence of wild-type miRNAs (WT seed) and miRNAs with mutated seed sequence (seed mut). Analysis of miRNAs with WT seed together with 3′ UTR with mutations on the MRE (MRE mut), was compared to that with the wild-type 3′ UTRs. Data represent mean ± SEM, ∗ p < 0.05, ∗∗ p < 0.01, ∗∗∗ p < 0.001, ns, not significant, two-sided Student’s t test WT seed versus seed mut, or MRE mut, n = 4 independent experiments. (B) qPCR for mature miRNAs from E8.5 mouse embryos dissected in left and right halves. Data represent mean ± SEM, ∗ p < 0.05, ∗∗ p < 0.01, two-sided Student’s t test left versus right halves, n = 4 independent pools of 6 halves per pool. (C) E8.5 mouse embryos were embedded and cryosectioned. Mature miRNA ISH was performed in transverse sections revealing higher miR-34a and miR-92a expression on the left-hand side (arrowheads), including the LPM. NT, neural tube; LPM, lateral plate mesoderm; som, somite. Scale bar: 100 μm. miR-16 is included as a control of a microRNA expressed in the in a bilateral symmetric manner, including the LPM. (D) EGFP transcription driven by the regulatory elements of prrx1a in transgenic zebrafish show bilaterally symmetric expression at the time when both transcripts and protein levels are L/R asymmetric (blue arrowheads in sections). Quantification of prrx1a area and width of signal is shown. Data represent interquartile distribution with 10–90 percentile, ∗∗∗ p < 0.001, two-sided Student’s t test prrx1a versus EGFP, n = 25 embryos per condition. Scale bar: 250 μm. (E) BMP signaling measured as p-SMAD1/5/8 protein expression shows bilateral symmetry. Scale bar: 250 μm. (F) In situ hybridization for Snail1 in E8.5 wt embryos show asymmetric expression in the right LPM (7/13, insets magnified below; LLPM/RLPM, left/right lateral plate mesoderm). EGFP transcripts in E8.5 transgenic (Tg) embryos show symmetric expression in the LPM (11/11, insets below). Scale bar: 100 μm. See also Figure S5. |
Reprinted from Developmental Cell, 51, Rago, L., Castroviejo, N., Fazilaty, H., Garcia-Asencio, F., Ocaña, O.H., Galcerán, J., Nieto, M.A., MicroRNAs Establish the Right-Handed Dominance of the Heart Laterality Pathway in Vertebrates, 446-459.e5, Copyright (2019) with permission from Elsevier. Full text @ Dev. Cell