
Fig. 4
- ID
- ZDB-FIG-200728-55
- Publication
- Rago et al., 2019 - MicroRNAs Establish the Right-Handed Dominance of the Heart Laterality Pathway in Vertebrates
- Other Figures
- All Figure Page
- Back to All Figure Page
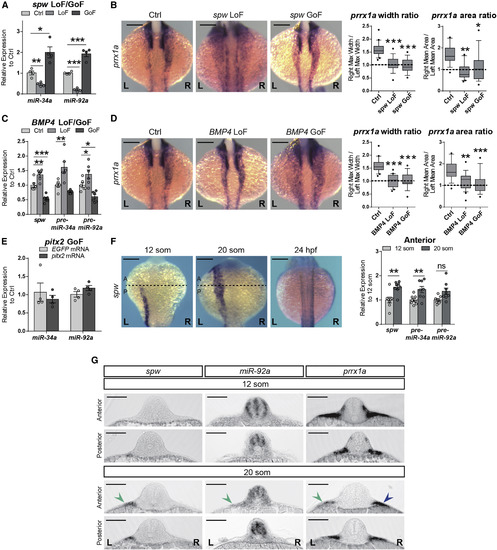
miRNA Expression Is Regulated by Nodal Wave (A) Zebrafish one-cell stage embryos were injected with southpaw mRNA (spw, GoF), spw-morpholino (LoF) or control MO (Ctrl), and were collected at 20-somite stage. Levels of mature miRNA expression are normalized to those in Ctrl. Data represent mean ± SEM, ∗ p < 0.05, ∗∗ p < 0.01, ∗∗∗ p < 0.001, ANOVA with Dunnett’s multiple comparison test GoF or LoF versus Ctrl, n = 4 independent experiments. (B) Representative embryos showing prrx1a expression after spw loss or gain of function (LoF and GoF, respectively) and quantification of R/L ratio of width and area of the signal. Data represent interquartile distribution with 10–90 percentile, ∗ p < 0.05, ∗∗ p < 0.01, ∗∗∗ p < 0.001, ANOVA with Dunnett’s multiple comparison test GoF or LoF versus Ctrl, n = 15–19 embryos per condition. Scale bar: 250 μm. (C) Zebrafish one-cell stage embryos were injected with BMP4 mRNAs or specific MO and analyzed at the 20-somite stage. Levels of spw and pre-miRNAs after BMP4 GoF or knockdown (LoF) were compared to a control (MO-Ctrl for LoF, EGFP mRNA for GoF). Data represent mean ± SEM, ∗ p < 0.05, ∗∗ p < 0.01, ∗∗∗ p < 0.001, ANOVA with Dunnett’s multiple comparison test GoF or LoF versus Ctrl, n = 6 independent experiments. (D) prrx1a expression upon BMP4 LoF/GoF and quantification of R/L ratios. Data represent mean ± SEM, ∗∗ p < 0.01, ∗∗∗ p < 0.001, ANOVA with Dunnett’s multiple comparison test GoF or LoF versus Ctrl, n = 15–19 embryos per condition. Scale bar: 250 μm. (E) Zebrafish embryos were injected at one-cell stage with EGFP mRNA (Ctrl) or pitx2a mRNA (pitx2 GoF), and embryos collected at 20-somite stage for qPCR. Mature miRNAs levels are normalized to Ctrl. Data represent mean ± SEM, n = 4 independent experiments. (F) In situ hybridization for spw at different stages. The dotted lines indicate the level of dissection to isolate anterior and posterior halves in embryos at the same stages. Four pools of 6–8 embryos were collected and analyzed for transcript levels. Graphs show relative levels of spw and pre-miRNAs transcripts normalized to those at the 12-somite stage. Data represent mean ± SEM, ∗∗ p < 0.01, ns = not significant, two-sided Student’s t test 12 som versus 20 som, n = 4 independent pools of 6–8 halves per pool. (G) Transverse sections taken at anterior and posterior levels of 12- and 20-somite stage zebrafish embryos hybridized with spw, prrx1a, and miR-92a probes. spw and miR-92a are detected on the anterior-left LPM only at the 20-somite stage and concomitant with a decrease in prrx1a expression (green arrowheads). Compare prrx1a levels between left and right sides (green and blue arrowheads, respectively). Scale bar: 250 μm. See also Figure S4. |
Reprinted from Developmental Cell, 51, Rago, L., Castroviejo, N., Fazilaty, H., Garcia-Asencio, F., Ocaña, O.H., Galcerán, J., Nieto, M.A., MicroRNAs Establish the Right-Handed Dominance of the Heart Laterality Pathway in Vertebrates, 446-459.e5, Copyright (2019) with permission from Elsevier. Full text @ Dev. Cell