Overview of MultiFRAGing method. (A) Primer design strategy for multiple targets. Gene-specific primers are designed to generate 180–300 bp fragments. The gene-specific forward primers are attached with an adapter sequence (M13Fwd, SP6, and T3), and the reverse primer contains a short PIGTAIL sequence to suppress the stutter peaks. Tailed gene-specific primers add M13Fwd or SP6 or T3 adapter sequences in the first few PCR cycles. (B) A third primer with same adapter sequence attached to a fluorescent dye (FAM, HEX and TAMRA) is used to generated fluorescently labeled fragments. After few PCR cycles, fluorophore-labeled primers act as forward primer and bind to the respective adapter sequences. In the subsequent PCR cycles, most fragments will incorporate fluorophore thus generating double-stranded fluorescent fragments. Multiple fragments are generated in a single PCR reaction. These fragments can either be tagged with same dye and generate products of different size or tagged with different dyes. (C) Pooled PCR products are mixed with a size standard to run on a genetic analyzer. Fragments sizes are plotted, and indel size can be measured based on the expected size of the wild type fragment. Wild-type samples will have one size (allele), while heterozygous samples will show two sizes (alleles).

Fragment Analysis PCR plots from wild-type samples and a pool of samples amplified together. (A) Wild-type controls for size comparison with two targets separated by different dyes. (B) Two targets are separated based on different dyes, showing a 2 bp or 1 bp deletion when compared to wild-type sizes. (C) Wild-type controls for size comparison with three targets separated by different dyes. (D) Three targets are separated by dye color, and show a 2 bp deletion, 4 bp insertion, and 1 bp deletion compared to wild-type sizes.

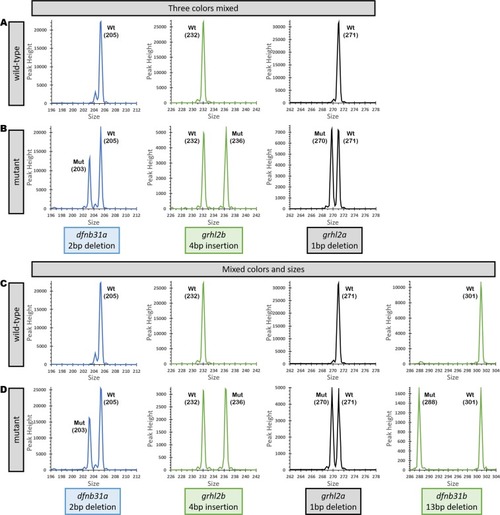
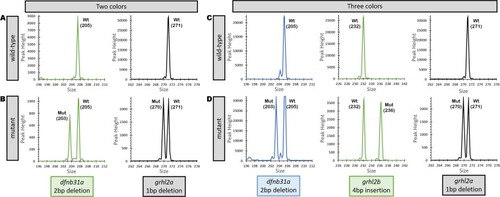
Fragment Analysis plots from wild-type controls and mutants from fragments separated by color, sizes and amplified individually, then pooled together for genetic analyzer. (A) Wild-type controls for size comparison with three targets separated by different dyes. (B) Three targets separated by different dyes showing indels of 2 bp deletion, 4 bp insertion, and 1 bp deletion when compared to wild-type sizes. (C) Wild-type controls for size comparison with targets separated by size and dye color. (D) Four targets separated by a combination of different sizes and dye colors showing indels of 2 bp deletion, 4 bp insertion,1 bp deletion, and 13 bp deletion when compared to wild-type sizes.

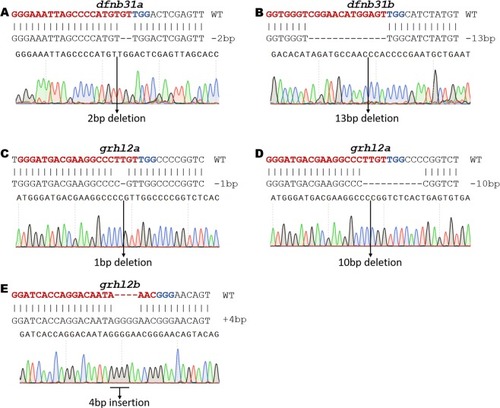
Validation of indels by Sanger Sequencing. Each indel that was identified by fragment analysis was sequenced using the Sanger method to establish the correlation between fragment analysis and Sanger sequencing Data. All indels from fragment analysis showed similar indel size in Sanger sequencing. (A) Alignment and chromatogram confirming a 2 bp deletion in dfnb31a. (B) Alignment and chromatogram confirming a 13 bp deletion in dfnb31b. (C) Alignment and chromatogram confirming a 1 bp deletion in grhl2a. (D) Alignment and chromatogram confirming a 10 bp deletion in grhl2a. (E) Alignment and chromatogram confirming a 4 bp insertion in grhl2b.

Acknowledgments
This image is the copyrighted work of the attributed author or publisher, and ZFIN has permission only to display this image to its users. Additional permissions should be obtained from the applicable author or publisher of the image. Full text @ Sci. Rep.