IMAGE

Figure 3

ID
ZDB-IMAGE-200302-46
Source
Figures for Petree et al., 2020
Image
Figure Caption

Figure 3

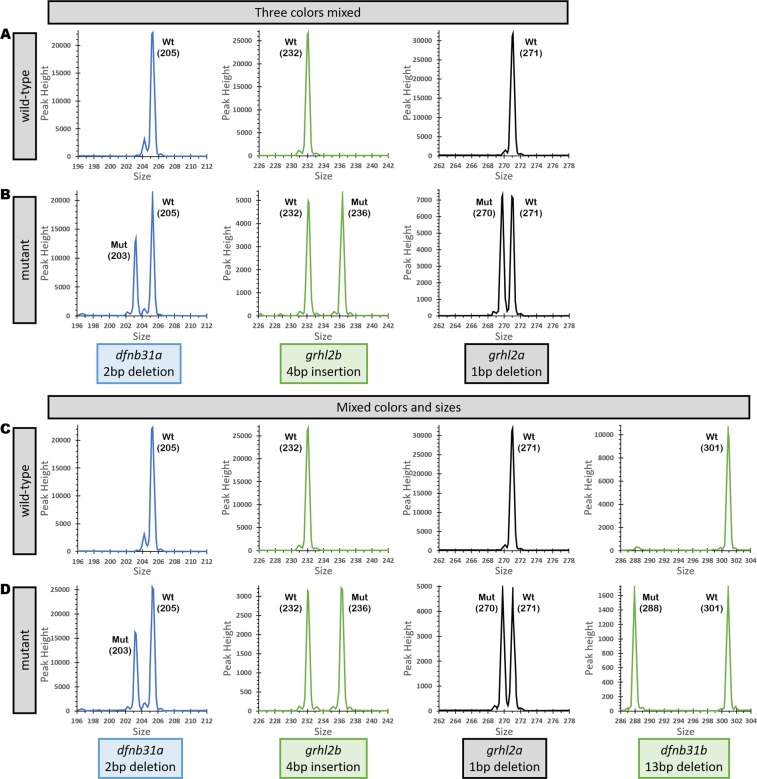
Fragment Analysis plots from wild-type controls and mutants from fragments separated by color, sizes and amplified individually, then pooled together for genetic analyzer. (A) Wild-type controls for size comparison with three targets separated by different dyes. (B) Three targets separated by different dyes showing indels of 2 bp deletion, 4 bp insertion, and 1 bp deletion when compared to wild-type sizes. (C) Wild-type controls for size comparison with targets separated by size and dye color. (D) Four targets separated by a combination of different sizes and dye colors showing indels of 2 bp deletion, 4 bp insertion,1 bp deletion, and 13 bp deletion when compared to wild-type sizes.

Acknowledgments
This image is the copyrighted work of the attributed author or publisher, and ZFIN has permission only to display this image to its users. Additional permissions should be obtained from the applicable author or publisher of the image. Full text @ Sci. Rep.