FIGURE SUMMARY
Title

Zebrafish modeling reveals that SPINT1 regulates the aggressiveness of skin cutaneous melanoma and its crosstalk with tumor immune microenvironment

Authors
Gómez-Abenza, E., Ibáñez-Molero, S., García-Moreno, D., Fuentes, I., Zon, L.I., Mione, M.C., Cayuela, M.L., Gabellini, C., Mulero, V.
Source
Full text @ J. Exp. Clin. Cancer Res.

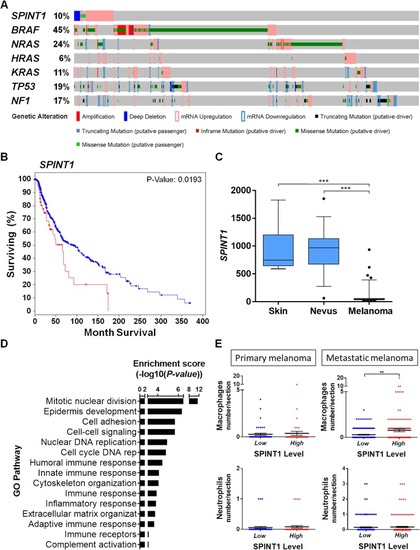
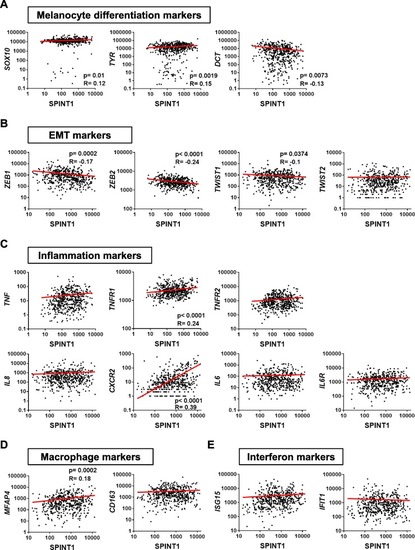
SPINT1 genetic alterations are associated with poor prognosis of SKCM patients. a Percentage of genetic alterations in oncogenes, tumor suppressor genes and SPINT1 in SKCM patients of the TCGA cohort (n = 479). b Survival curve of patients with genetic alteration (increased mRNA level, missense mutations and deep deletions, red line) vs. wild type (blue line) SPINT1 of SKCM of the TCGA cohort. Kaplan–Meier Gehan-Breslow-Wilcoxon and nonparametric Log-rank Test. Hazard ratio = 1.625; 95% CI of ratio = 1.099–3.033. c Genetic expression of SPINT1 in human samples from normal skin, nevus and malignant melanoma from GEO data set GDS1375 and 202826_at probe (n = 70). ***p < 0.001 according to ANOVA and Tukey’s Multiple Comparison Test. d Enrichment analysis of GO biological process. Representation of the most significant GO biological process altered when SPINT1 is affected by missense mutations or copy-number alterations. Analysis Type: PANTHER Overrepresentation Test (Released 05/12/2017), Test Type: FISHER. e Number of infiltrated macrophages and neutrophils in SKCM samples of the TCGA cohort (n = 468). The number of infiltrated cells in SKCM samples with low (blue) or high (red) SPINT1 mRNA levels according to the median. The mean ± S.E.M. for each group is shown. *p < 0.05; **p < 0.01 according to Student t Tests

SPINT1 expression correlates with aggressiveness marker expression in human SKCM biopsies. Correlation of SPINT1 gene expression with those of the melanocyte differentiation markers SOX10, TYR and DCT (a) the EMT markers ZEB1, ZEB2, TWIST1 and TWIST2 (b), the inflammation markers TNFA, TNFR1, TNFR2, IL8 (CXCL8), CXCR2, IL6 and IL6R (c), the macrophage markers MFAP4 and CD163 (d) and the interferon markers ISG15 and IFIT1 (e) in human SKCM biopsies of the TCGA cohort. The statistical significance of the correlation was determined using Pearson’s correlation coefficient. A linear regression-fitting curve in red is also shown

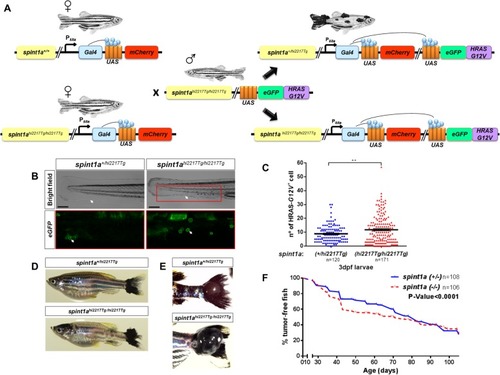
Inflammation accelerates the onset of SKCM in zebrafish. a Schematic diagram of the generation of the SKCM model line in zebrafish with Spint1a deficiency. b and c Representative images (b) and number of early oncogenically transformed eGFP-HRAS-G12V+ cells in the boxed area (c) in Spint1a-deficient larvae and control siblings at 3 dpf. Note the morphological alterations observed in the inflamed skin of the mutants (white arrows). eGFP-HRAS-G12V+ goblet cells are marked with white arrows. Scale bar 250 μm. Each point on the scatter plot represents one larva and the mean ± SEM is also shown. ** p < 0.05 according to an unpaired Student t test with Welch’s correction. d-f Impact of Spint1a deficiency on SKCM onset in zebrafish. Representative images of whole fish (d) and of nodular tail tumors (e), and Kaplan-Meier curve showing the percentage of SKCM-free fish in control and Spint1a-deficient adult fish (f). p < 0.0001 according to a Log rank Mantel-Cox test; Hazard ratio = 0.7962; 95% CI of ratio = 0.6834–0.9056

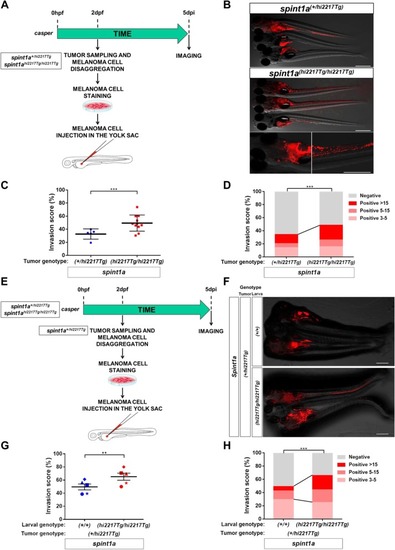
Spint1a deficiency is required at cell autonomous and non-autonomous levels to enhance SKCM cell dissemination in a zebrafish larval allotrasplantation model. Analysis of dissemination of control and Spint1a-deficient SKCM allotransplants in wild type larvae (a-d) and SKCM allotransplants in wild type and Spint1a-deficient larvae (e-h). a and e Experimental design. b and f Representative images (overlay of bright field and red channels) of SKCM invasion at 5 dpi. Bars: 500 μm. c and g Percentage of invaded larvae for both tumor genotypes. Each dot represents a single tumor and the mean ± SEM is also shown. **p < 0.01, ***p < 0.0001 according to unpaired Student t test. d and h Number of tumor foci per larva. ***p < 0.0001 according to Chi-square Tests

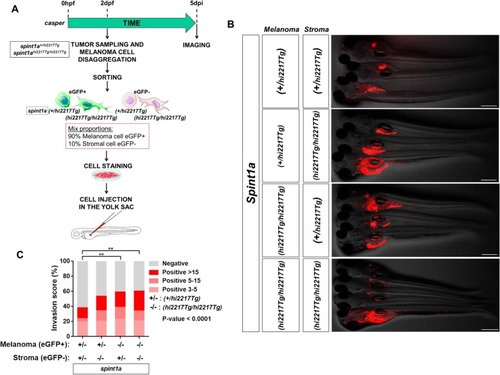
Spint1a deficiency both in stromal and tumor cell enhances SKCM dissemination in zebrafish larval model. a Allotransplant experimental design. Combinations of Spint1a-deficient tumor and stromal cells from SKCMs were mixed with wild type tumor and stromal cells. All possible cell combinations were obtained maintaining the initial ratio. b Representative images (overlay of bright field and red channels) of the invasion in wild type recipient larvae at 5 dpi. Bar: 500 μm. c Number of tumor foci per larva (n = 5 SKCM tumors). **p < 0.01 according to a Chi-square Test

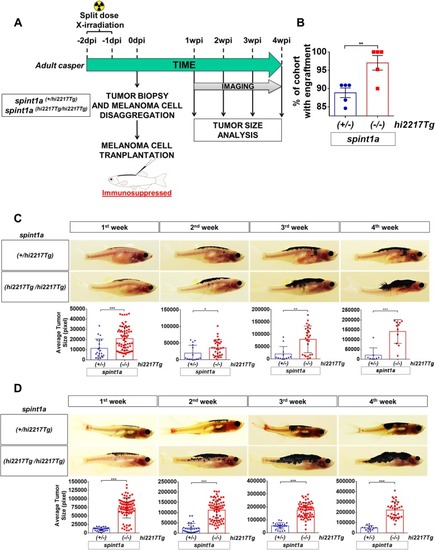
Spint1a-deficient SKCM shows enhanced aggressiveness in adult zebrafish allotransplantation assays. a Experimental workflow of adult allotransplantation experiments in pre-irradiated adult casper zebrafish. b Percentage of engraftment for both control and Spint1a-deficient tumors. Each dot represents a single SKCM tumor and the mean ± SEM is also shown (n = 5). c and d Representative images and average tumor size (pixels) from 1 to 4 weeks post-transplant of primary (c) and secondary (d) transplants. Each dot corresponds to a recipient-transplanted fish and the mean ± SEM is also shown. b-d *p < 0.05, **p < 0.01, ***p < 0.001 according to unpaired Student t test

Acknowledgments
This image is the copyrighted work of the attributed author or publisher, and ZFIN has permission only to display this image to its users. Additional permissions should be obtained from the applicable author or publisher of the image. Full text @ J. Exp. Clin. Cancer Res.