IMAGE

Fig. 2

ID
ZDB-IMAGE-191230-137
Source
Figures for Gómez-Abenza et al., 2019
Image
Figure Caption

Fig. 2

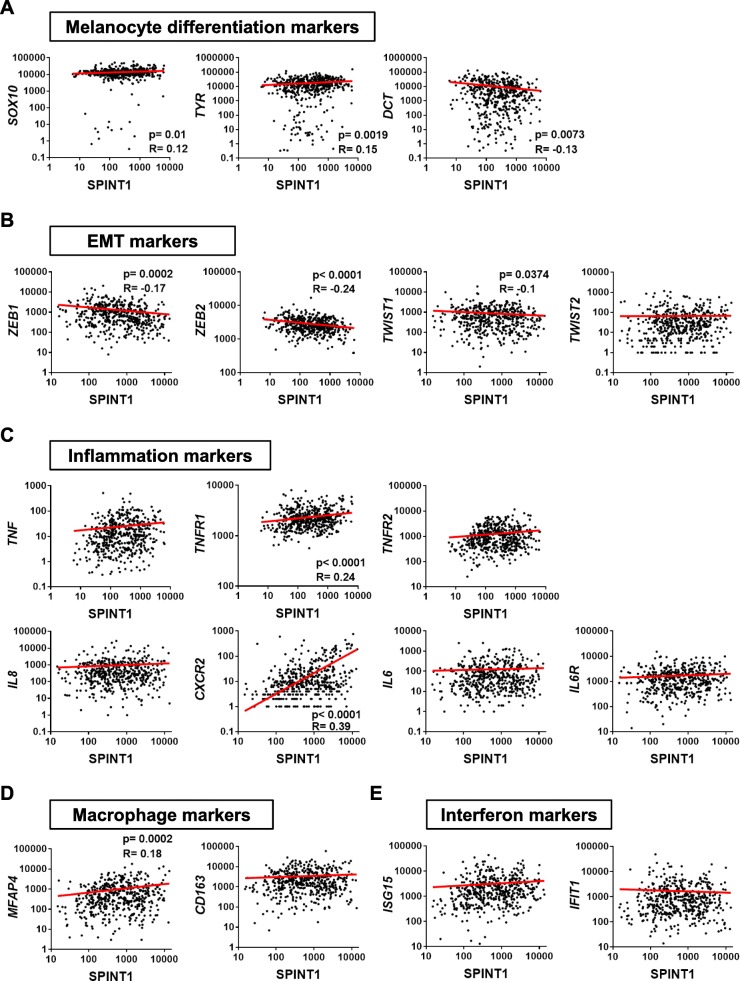
SPINT1 expression correlates with aggressiveness marker expression in human SKCM biopsies. Correlation of SPINT1 gene expression with those of the melanocyte differentiation markers SOX10, TYR and DCT (a) the EMT markers ZEB1, ZEB2, TWIST1 and TWIST2 (b), the inflammation markers TNFA, TNFR1, TNFR2, IL8 (CXCL8), CXCR2, IL6 and IL6R (c), the macrophage markers MFAP4 and CD163 (d) and the interferon markers ISG15 and IFIT1 (e) in human SKCM biopsies of the TCGA cohort. The statistical significance of the correlation was determined using Pearson’s correlation coefficient. A linear regression-fitting curve in red is also shown

Acknowledgments
This image is the copyrighted work of the attributed author or publisher, and ZFIN has permission only to display this image to its users. Additional permissions should be obtained from the applicable author or publisher of the image. Full text @ J. Exp. Clin. Cancer Res.