
- Title
-
Axon-Axon Interactions Regulate Topographic Optic Tract Sorting via CYFIP2-Dependent WAVE Complex Function
- Authors
- Cioni, J.M., Wong, H.H., Bressan, D., Kodama, L., Harris, W.A., Holt, C.E.
- Source
- Full text @ Neuron

ZFIN is incorporating published figure images and captions as part of an ongoing project. Figures from some publications have not yet been curated, or are not available for display because of copyright restrictions. |
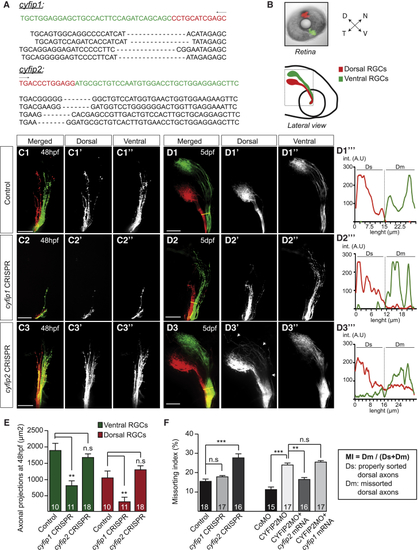
Differential Function of CYFIP1 and CYFIP2 during RGC Axonal Development (A) Sequence analysis of the whole zebrafish embryo injected with cas9 mRNA + cyfip1 or cyfip2 gRNAs. The target site is indicated on the sequence (green), followed by 4 examples of corresponding mutated regions. (B) DiI (red) and DiO (green) fluorescent dyes were injected in the zebrafish embryo retina at 5 dpf. The dashed line denotes the confocal imaging area of the optic tract (OT). (C1–D3′′′) Dorsal (D) (C1′–C3′, D1′–D3′) and Ventral (V) (C1′′–C3′′, D1′′–D3′′) RGC projections were analyzed in control embryos (cas9 mRNA + gRNA control) (C1, D1), cyfip1 CRISPR-injected embryos (cas9 mRNA + gRNA cyfip1) (C2, D2), and cyfip2CRISPR-injected embryos (cas9 mRNA + gRNA cyfip2) (C3, D3) at 48 hpf (C) and 5 dpf (D). Arrows in (D3′) show missorted dorsal axons in the OT. Yellow lines in (D1)–(D3) indicate the reference line used for quantification of the missorting index (MI). Examples of DiI (dorsal) and DiO signals plotted along the reference line corresponding to sorted (D1′′′, D2′′′) or misprojected (D3′′′) RGC axons (int., intensity; A.U, Arbitrary Units). (E) Quantifications of D and V axonal projection area in the OT at 48 hpf. (F) The missorting index (MI) was quantified as the ratio of the intensity signal of the missorted D (Dm) axons to all the D axons (Dm+Ds). For gRNA cyfip1-injected embryos, only the embryos showing an axon growth phenotype were quantified (n = 18 embryos). Error bars represent SEM. ∗∗p < 0.01, ∗∗∗p < 0.001, n.s., non significant (Mann-Whitney test for E and F). The number of zebrafish analyzed is indicated on the bars. Scale bars: 50 μm (C1–D3). See also Figure S1.
|
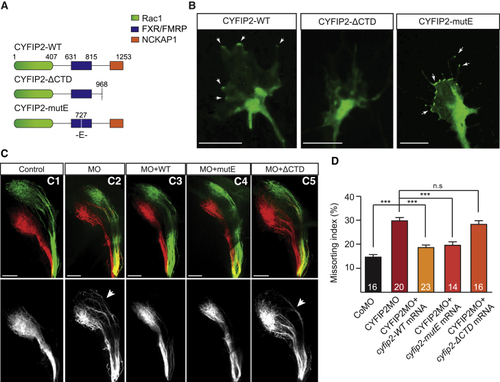
CYFIP2 Regulation of the WRC Mediates Axon Sorting in the Tract (A) Schematic illustrating CYFIP2’s regulatory domains and mutations. (B) Representative examples of CYFIP2WT-GFP (n = 9 GC), CYFIP2ΔCTD-GFP (n = 11 GC), and CYFIP2mutE-GFP (n = 13 GC) expression in Xenopus retinal cultures (n = 4 experiments). Arrows indicate CYFIP2-GFP accumulation in the growth coneperipheral domain and filopodia. (C1–C5) Lateral-view of whole-mount 5 dpf zebrafish embryos injected with DiI and DiO in the dorsal and ventral retina, respectively. Co-injection of CYFIP2MO + CYFIP2WT (C3) or CYFIP2mutE (C4), but not CYFIP2ΔCTD (C5), mRNAs rescue the pre-sorting defect observed in CYFIP2MO-injected embryos (C2) compared to CoMO-injected embryos (C1). (D) Quantification of the Missorting Index (Mann-Whitney test, ∗∗∗p < 0.001, n.s., non-significant). Error bars represent SEM. The number of zebrafish analyzed is indicated on the bars. Scale bars: 5 μm (B) or 50 μm (C). See also Figures S3 and S4. (E) Quantifications of D and V axonal projection area in the OT at 48 hpf. (F) The missorting index (MI) was quantified as the ratio of the intensity signal of the missorted D (Dm) axons to all the D axons (Dm+Ds). For gRNA cyfip1-injected embryos, only the embryos showing an axon growth phenotype were quantified (n = 18 embryos). Error bars represent SEM. ∗∗p < 0.01, ∗∗∗p < 0.001, n.s., non significant (Mann-Whitney test for E and F). The number of zebrafish analyzed is indicated on the bars. Scale bars: 50 μm (C1–D3). See also Figure S1.
|