
- Title
-
Identification of regulatory elements recapitulating early expression of L-plastin in the zebrafish enveloping layer and embryonic periderm
- Authors
- Baumgartner, E.A., Compton, Z.J., Evans, S., Topczewski, J., LeClair, E.E.
- Source
- Full text @ Gene Expr. Patterns
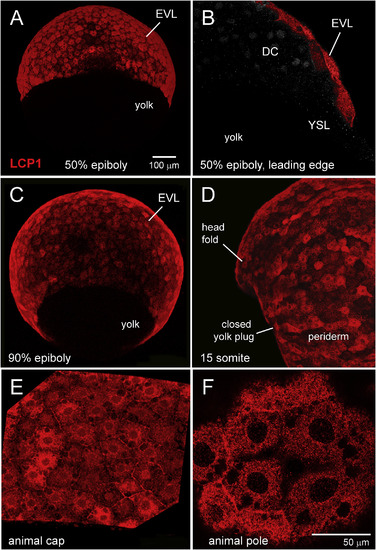
Immunohistochemical survey of L-plastin expression in early zebrafish development. A. Enveloping layer (EVL) expression at 50% epiboly, seen in equatorial view. B. EVL expression at 50% epiboly, seen in cutaway view of a single focal plane. The squamous EVL is strongly stained, in contrast to the deep cells (DC) and the yolk syncytial layer (YSL). C. EVL expression at 90% epiboly, seen obliquely from the vegetal pole. D. Periderm expression at the somite stage. Stain intensity is variegated, appearing brighter or darker in adjacent cells. E. 70% epiboly, intermediate magnification of animal cap EVL. F. 70% epiboly, high magnification of animal cap EVL. In this single focal plane, L-plastin expression appears as tightly packed cytoplasmic dots or clumps. DC = deep cells; EVL = enveloping layer; YSL = yolk syncytial layer. |
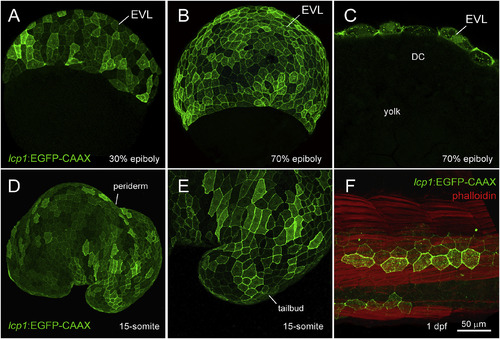
Transgenic expression in lcp1:EGFP-CAAX embryos. A. 30% epiboly, transgenic embryo in equatorial view. The EVL shows weak, variegated EGFP expression. B. 70% epiboly, transgenic embryo in equatorial view. Signal intensifies as the EVL spreads over the yolk. C. 70% epiboly, cutaway view of a single focal plane. Only EVL cells are EGFP+, in contrast to the deep cells (DC) and yolk syncytial layer (YSL). D. Live embryo at the 15-somite stage. lcp1:EGFP-CAAX labels the periderm, the outermost epithelial layer. E. Magnification of the tailbud in D, showing variegated EGFP in adjacent peridermal cells. F. Fixed embryo at 1 dpf, with phalloidin-568 counterstain. A patch of label-retaining peridermal cells (green) lies over the developing trunk musculature (red). |
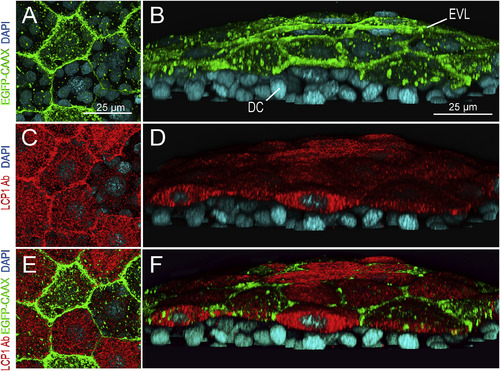
lcp1:EGFP-CAAX and endogenous LCP1 protein co-label the EVL in transgenic embryos. A. Z-projection showing EGFP signals in EVL cells of a lcp1:EGFP-CAAX gastrulating embryo. Signals are strongest in the membrane, with scattered foci in cytoplasmic vesicles and perinuclear Golgi. B. Tilted stack of the same volume as (A), showing EGFP in the EVL but not in the underlying deep cells (DC). C,D. Red channel views of the same volume, showing whole-mount immunostaining with anti-zebrafish L-plastin. Stain intensity is variegated, but is limited to the EVL. E. Merged image of A and C. F. Merged image of B and D. As expected, the two labels are in different compartments: transgenic EGFP-CAAX highlights the EVL membrane, while endogenous L-plastin (an actin-bundling protein) fills the EVL cytoplasm. Neither signal appears in the deep cells |
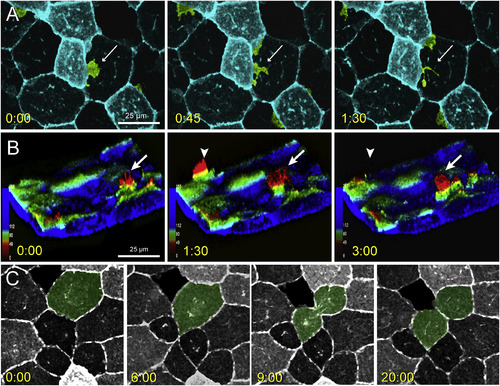
Lateral protrusive activity, radial protrusive activity, and mitotic events in lcp1:EGFP-CAAX EVL cells. A. Time-lapse imaging of EVL lateral protrusive activity (Movie S2). The view is of the animal cap, and several membrane projections are false-colored green. A bright EVL cell extends a lamellipodial projection (white arrow) under the nucleus of an adjacent dark cell. The projection then breaks up into smaller filopods and vesicles. B. Time-lapse imaging of EVL radial protrusive activity (Movie S3). The confocal volume has been segmented to remove the deep cell layer, inverted to show EVL membranes extending upwards, and recolored using an automated depth-coding scheme. Blue voxels = apical extreme; red voxels = basal extreme. Radial protrusions appear as yellow-to-red spikes (white arrows) that extend and retreat every few minutes. C. Time-lapse imaging of EVL mitosis. The dividing cell is false-colored green. EGFP expression levels vary from cell to cell but are stable throughout the cell cycle. When mitoses occur, daughters inherit the parental signal. Timestamp for all panels = minutes:seconds. |
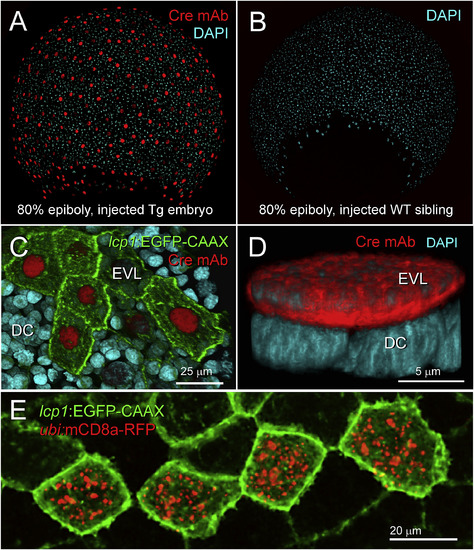
Expression and activity of Cre recombinase in lcp1(Cre-P2A-EGFP-CAAX) transgenic embryos. A. Fixed transgenic embryo at 80% epiboly. Immunohistochemical labeling shows robust nuclear signal in all EVL cells. red = anti-Cre monoclonal antibody, blue = DAPI nuclear stain. B. Fixed wild type sibling embryo co-stained with the specimen in (A). Although exposed to the same primary and secondary antibody solutions, no nuclei stain red. C. Fixed transgenic embryo, animal cap at 80% epiboly. EGFP and Cre signals are positively correlated. Cells with bright membranes have bright nuclei; cells with dim membranes have dim nuclei. D. High magnification view of a single, Cre-positive EVL nucleus (red) overlying multiple Cre-negative deep cell nuclei (blue). E. In vivo confirmation of Cre activity. After transient transgenesis with a Cre reporter plasmid, a live cluster of transgenically labeled periderm cells (green) expresses recombinant RFP-tagged mouse CD8a (red). For details, see Methods. |
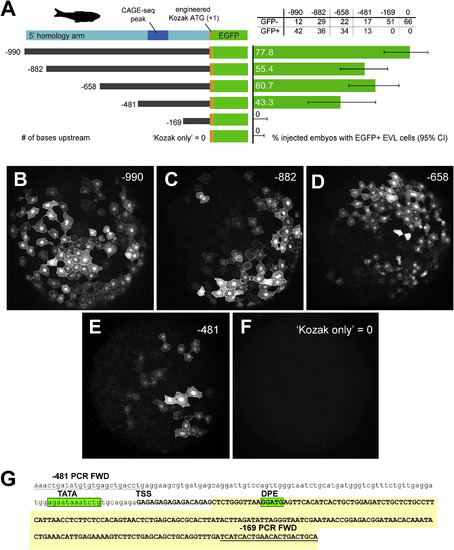
In vivo validation of zebrafish first intron promoter and enhancer activity. A. LEFT: 5′ deletion series of the zebrafish 5′ homology arm upstream of the transgenic cassette (lcp1:Cre-P2A-EGFP-CAAX, abbreviated ‘EGFP’). Constructs are numbered according to the number of bases upstream of the engineered translation start site (ATG, where A = +1.) A. RIGHT: Results of deletion-series injections. Green bars = proportion of injected embryos with EGFP + EVL cells. Gray lines = 95% confidence interval on the proportion. B-F. Animal cap views of injected, EGFP + embryos collected at 50% epiboly. G. Annotation of the minimal intronic region (−481 to −169) sufficient for EVL activity. The deletion-construct forward PCR primers are underlined. The predicted transcript is in UPPER CASE. TATA = TATA box motif; TSS = transcription start site; DPE = downstream promoter element. The EST ‘foothill’ (See Fig. 7, Fig. 8) is shaded yellow. |
Reprinted from Gene expression patterns : GEP, 32, Baumgartner, E.A., Compton, Z.J., Evans, S., Topczewski, J., LeClair, E.E., Identification of regulatory elements recapitulating early expression of L-plastin in the zebrafish enveloping layer and embryonic periderm, 53-66, Copyright (2019) with permission from Elsevier. Full text @ Gene Expr. Patterns