
- Title
-
In vivo monitoring and high-resolution characterizing of the prednisolone-induced osteoporotic process on adult zebrafish by optical coherence tomography
- Authors
- Lin, Y., Xiang, X., Chen, T., Gao, C., Fu, H., Wang, L., Deng, L., Zeng, L., Zhang, J.
- Source
- Full text @ Biomed. Opt. Express
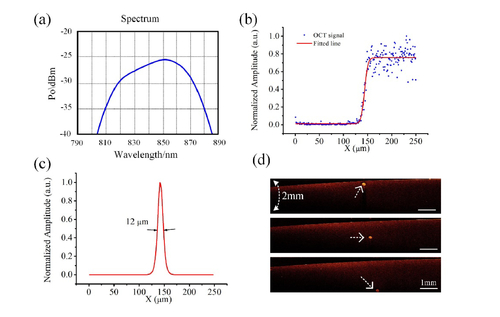
(a) The spectrum of superluminescent diode used in the OCT system. (b) Normalized amplitude OCT signal of a B-scan line across a blade with sharp edges. (c) The lateral resolutions of the OCT imaging system. (d) OCT images of a hair section at different position. |

Whole mount chine alizarin red staining results (a) and corresponding optical density (b) of normal zebrafish or zebrafish induced with 125 μM prednisolone 21 days. |

(a) OCT image and histological result (b) of normal zebrafish skull. (c) OCT image and histological result (d) of skull of 21-days prednisolone (125 μM) induced zebrafish model. |
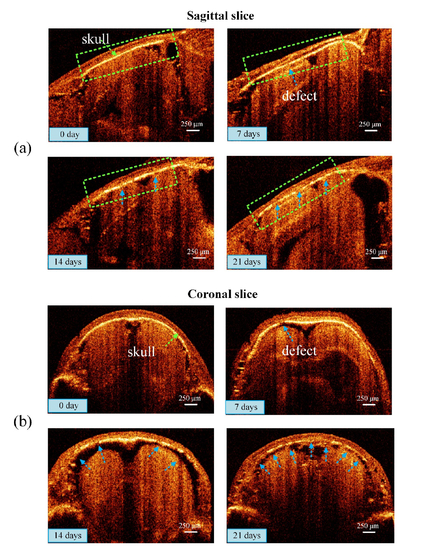
The sagittal OCT images (a) and the coronal SD-OCT images (b) of adult zebrafish before (0 day) or after125 μM prednisolone treatment (7, 14 or 21 days). |

(a) In vivo SD-OCT images of normal zebrafish and zebrafish treated with different concentrations of prednisolone (50 μM or 125 μM) at 0, 7, 14 or 21 days. (b) The defect number of skull vs exposure time and concentration of prednisolone. |
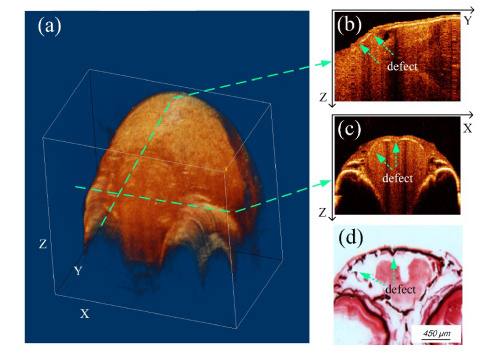
(a) 3D OCT images of zebrafish head treated prednisolone (125 μM, 7 days). (b) and (c) is the sagittal images and the coronal image obtained from virtual slices along green dotted lines. (d) Corresponding histological image of the coronal image. |