
- Title
-
Noise-resistant developmental reproducibility in vertebrate somite formation
- Authors
- Naoki, H., Akiyama, R., Sari, D.W.K., Ishii, S., Bessho, Y., Matsui, T.
- Source
- Full text @ PLoS Comput. Biol.
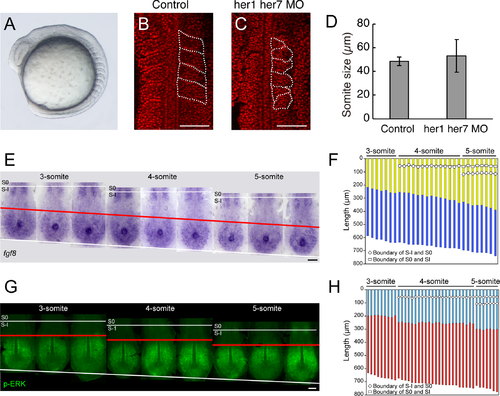
Somite reproducibility and stepwise ERK activity shift for somite formation. (A) Lateral view of a wild-type zebrafish embryo during somitogenesis. (B, C) Somite morphology in wild-type (B) or clock-deficient embryos co-injected with her1 and her7morpholinos. Nuclei are stained by propidium iodide (red). Somites are outlined by dotted lines. Scale bar: 100 μm. (D) Somite sizes in control and clock-deficient embryos (n = 16 each). The somite size variation in clock-deficient embryos (61.1 ± 16.9 μm; C.V. = 0.28) was larger than that in control embryos (50.3 ± 3.6 μm; C.V. = 0.07). Data represent the means and standard deviations. (E) Representative dorsal view of PSM fgf8a mRNA expression at 3- to 5-somite stages. Red line, fgf8a gradient boundary. Scale bars: 100 μm. (F) Quantitative presentation of fgf8a expression. Embryos (n = 29) were arranged in order of developmental stages, as estimated by somite number and PSM length. High (purple stripe) and low (yellow stripe) fgf8a expression domains in each embryo. (G) Representative dorsal view of PSM pERK distribution at 3- to 5-somite stages. Red line, pERK boundary. (H) Quantitative presentation of pERK distribution. Embryos (n = 39) were arranged as in (F). ON (red stripe) and OFF (blue stripe) ERK activity regions in each embryo. Panels B, C, and E-H are adapted with permission from our previous paper |
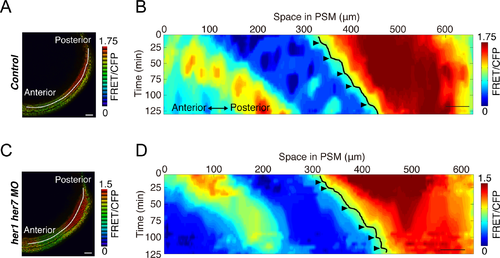
Stepwise ERK activity shifts in control and clock-deficient zebrafish embryos. (A, C) FRET-based ERK biosensor mRNAs were injected into control (A) and clock-deficient zebrafish embryos (C). ERK activity was calculated by FRET/CFP ratio in embryos at the 8-somite stage and visualized by intensity-modulated display mode. A line of interest for kymograph analysis is depicted. Scale bar, 50 μm. (B, D) Kymographs of the control and clock-deficient embryos. ERK activity is shown by the heat map. Black lines indicate the ERK activity borders, which show the stepwise shift at regular timing in control embryo (B) and at irregular timing in clock-deficient embryo (D). Scale bar, 50 μm. This figure is modified from our recent paper |