
|
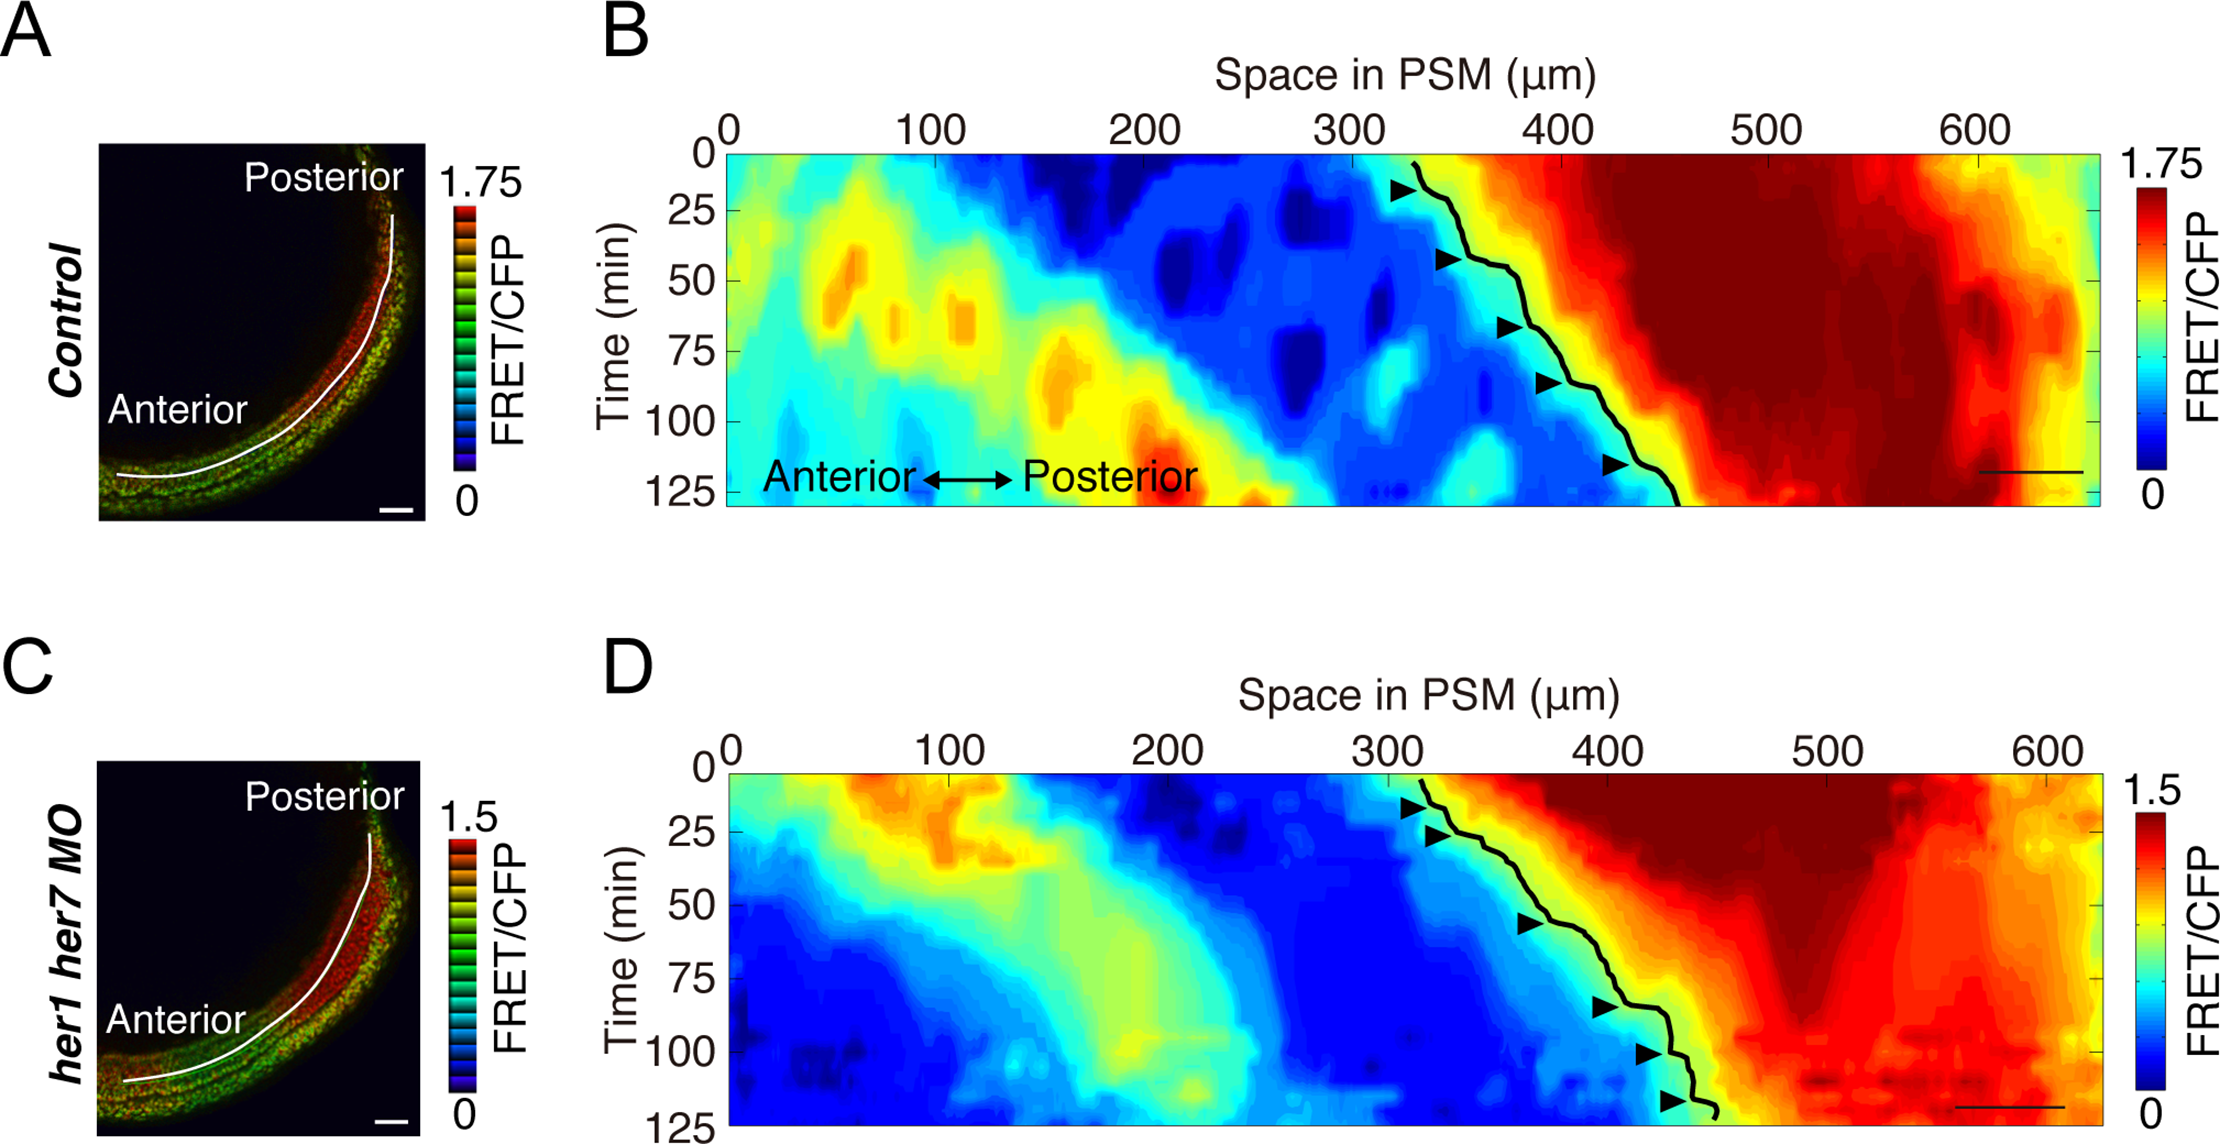
Fig. 8
(A, C) FRET-based ERK biosensor mRNAs were injected into control (A) and clock-deficient zebrafish embryos (C). ERK activity was calculated by FRET/CFP ratio in embryos at the 8-somite stage and visualized by intensity-modulated display mode. A line of interest for kymograph analysis is depicted. Scale bar, 50 μm. (B, D) Kymographs of the control and clock-deficient embryos. ERK activity is shown by the heat map. Black lines indicate the ERK activity borders, which show the stepwise shift at regular timing in control embryo (B) and at irregular timing in clock-deficient embryo (D). Scale bar, 50 μm. This figure is modified from our recent paper