
- Title
-
ERK Activity Dynamics during Zebrafish Embryonic Development
- Authors
- Wong, K.L., Akiyama, R., Bessho, Y., Matsui, T.
- Source
- Full text @ Int. J. Mol. Sci.
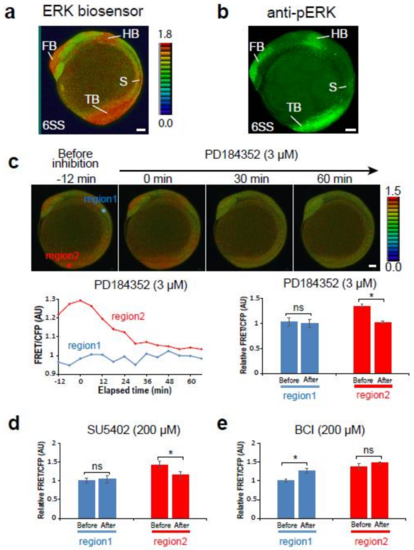
The Teen allowed monitoring of extracellular signal-regulated kinase (ERK) activity in living zebrafish embryos. (a, b) ERK activity detected by the ERK biosensor (8-color heat map) (a) or an anti-pERK antibody (green); (b) lateral view. Scale bar, 50 m. FB, forebrain; HB, hindbrain; S, somite; TB, tail bud. (c–e) Changes of ERK activity in 6-somite stage Teen embryos treated with the MEK inhibitor (3 M PD184352, n = 3) (c), the Fgf receptor inhibitor (200 M SU5402, n = 3) (d), or the ERK phosphatase inhibitor (200 M BCI, n = 3) (e). Region 1, a region between the hindbrain and first somite; region 2, tail bud. Before, 0 min; after, 60 min. * p < 0.05; ns, not significant; error bars, standard deviation. |
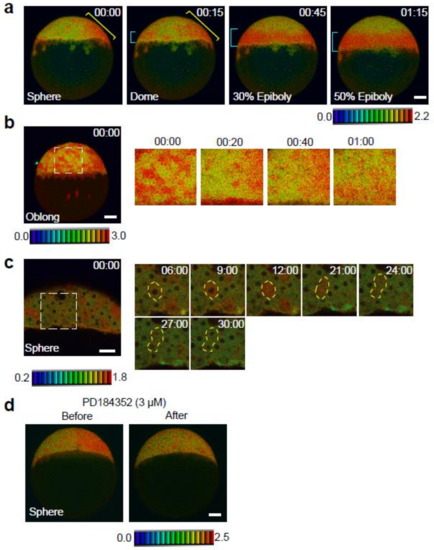
Spatial and temporal map of ERK activity during the late blastula stage. (a) ERK activity dynamics from sphere to 50%-epiboly stages. Lateral view, anterior to the top. Blue and yellow brackets indicate the embryonic margin and future dorsal region, respectively. (b) ERK activity dynamics in the rectangle (white dotted line) from the left panel. Cells migrate towards the vegetal pole, and changes in ERK activation from high to low (or from low to high) can be seen. (c) ERK activation during cell cycle progression. Higher magnification view of the rectangle (white dotted line) in the left panel. Before cell cleavage (M phase), ERK activity increased, whereas it was low in other phases. The yellow dotted line marks the outline of the cell. (d) Changes of ERK activity in sphere stage Teen embryos treated with the MEK inhibitor (3 M PD184352, n = 6). Before, 0 min; after, 60 min. Scale bar, 100 m.
|
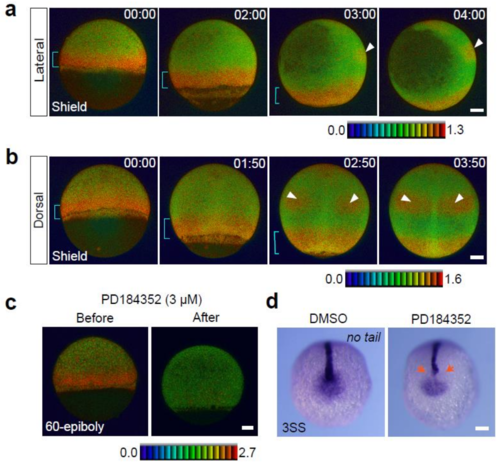
Spatial and temporal map of ERK activity during the gastrula stage. (a) Lateral view, anterior to the top. (b) Dorsal view, anterior to the top. A blue bracket indicates the embryonic margin. White arrowheads mark the future hindbrain. (c) Changes of ERK activity in gastrula stage Teen embryos treated with the MEK inhibitor (3 M PD184352, n = 8). Before, 0 min; after, 60 min. (d) no tail expression in 3SS embryos treated with DMSO (n = 21) or PD184352 (n = 24) for 2 h (from shield to 75-epiboly stages). Inhibition of ERK during the gastrula stages leads to failures of mesodermal cell patterning in notochord and tail bud. Scale bar, 100 m. |
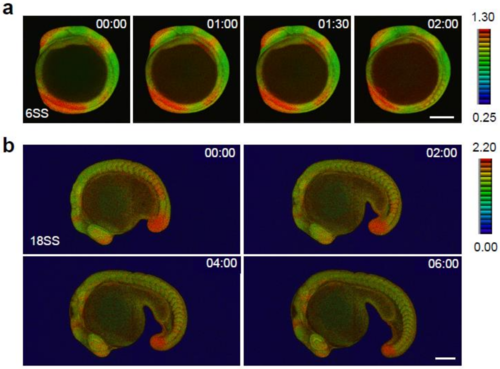
Spatial and temporal map of ERK activity during somitogenesis. (a) ERK activity dynamics from 6SS to 10SS stages. Lateral view, anterior to the top. (b) ERK activity dynamics from 18SS to 30SS stages. Lateral view, anterior to the left. Scale bar, 200 m. |
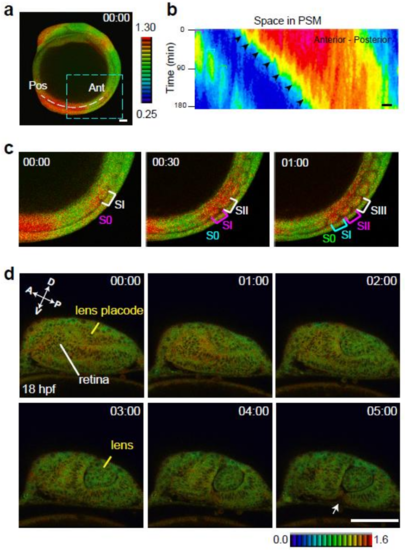
ERK activity dynamics in specific tissues/organs. (a) A white dotted line represents the region of interest for kymograph analysis. (b) Kymograph of the spatial and temporal dynamics of ERK activity in the presomitic mesoderm at the tail bud. Horizontal and vertical axes indicate the length from the anterior end of the presomitic mesoderm (m) and time progression (min), respectively. Scale bar, 50 m. (c) Higher magnification of the rectangle (light blue dotted line) in panel a. Newly developed somites are indicated by S0. Brackets indicate somite formation. The appearance of S0 (pink) indicates ERK activation within the S0. ERK activation level is high when S0 becomes SI (pink bracket), and the level decreases when SI becomes SII (pink bracket). Scale bar, 100 m. (d) At 18 hpf, ERK activation is observed in the retina and lens placode. During lens formation (18–20 hpf), ERK activation decreases gradually in the lens placode and remains stable in the retina. ERK activity decreases in the anterior side of the retina and is then restricted to the fissure of the retina on the ventral side.
|
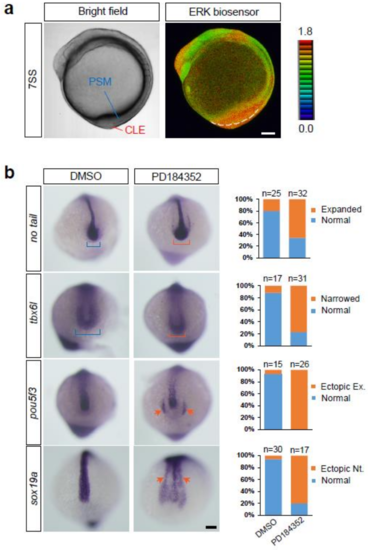
Roles of ERK activity in the tail bud. (a) Bright field (left panel) and ERK activity (right panel) of the embryo at the 7-somite stage. PSM, pre-somitic mesoderm; CLE, caudal lateral epiblast. Lateral view, anterior to the top. Scale bar, 100 m. (b) Expression of no tail, tbx6l, pou5f3, and sox19a in embryos treated with DMSO (vehicle) or the MEK inhibitor PD184352. In MEK inhibitor-treated embryos, a pool of axial stem cells (caudal region of the neural tube), which is marked by no tail expression, expanded (orange bracket, the first row from the top), and the paraxial mesoderm, marked by tbx6l, became narrower (orange bracket, second row from the top). In addition, ectopic neural tube formation, as evidenced by expression of pou5f3 (a marker of neural progenitors; orange arrows, third row from the top) and sox19a (orange arrows, fourth row from the top), was frequently induced in MEK inhibitor-treated embryos. Scale bar, 100 m. |