
FIGURE
Fig. 4
- ID
- ZDB-FIG-190530-38
- Publication
- Wong et al., 2018 - ERK Activity Dynamics during Zebrafish Embryonic Development
- Other Figures
- All Figure Page
- Back to All Figure Page
Fig. 4
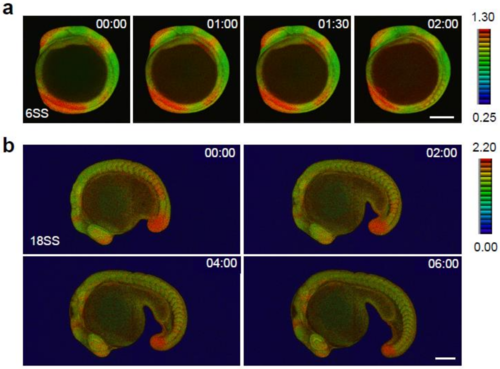
Spatial and temporal map of ERK activity during somitogenesis. (a) ERK activity dynamics from 6SS to 10SS stages. Lateral view, anterior to the top. (b) ERK activity dynamics from 18SS to 30SS stages. Lateral view, anterior to the left. Scale bar, 200 m. |
Expression Data
Expression Detail
Antibody Labeling
Phenotype Data
Phenotype Detail
Acknowledgments
This image is the copyrighted work of the attributed author or publisher, and
ZFIN has permission only to display this image to its users.
Additional permissions should be obtained from the applicable author or publisher of the image.
Full text @ Int. J. Mol. Sci.