
- Title
-
Cerebral Cavernous Malformation 1/2 complex controls ROCK1 and ROCK2 complementary functions for endothelial integrity
- Authors
- Lisowska, J., Rödel, C.J., Manet, S., Miroshnikova, Y.A., Boyault, C., Planus, E., De Mets, R., Lee, H.H., Destaing, O., Mertani, H., Boulday, G., Tournier-Lasserve, E., Balland, M., Abdelilah-Seyfried, S., Albiges-Rizo, C., Faurobert, E.
- Source
- Full text @ J. Cell Sci.
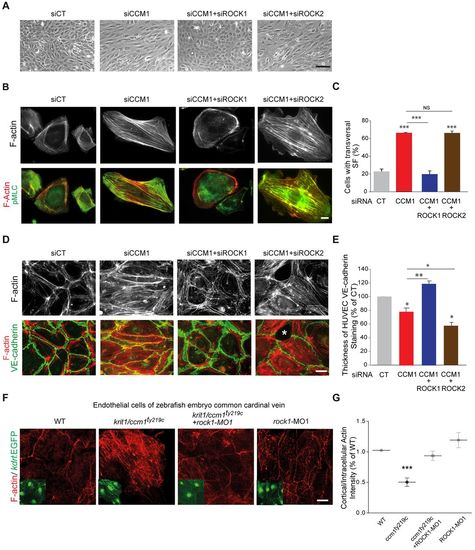
ROCK1 silencing restores normal adhesive and contractile phenotypes in CCM1-depleted HUVECs and zebrafish ccm1 mutant CCV endothelial cells. (A) Representative phase contrast images of siRNA-transfected HUVEC monolayers. (B) Representative immunofluorescence of sparsely plated siRNA-transfected HUVECs stained for F-actin (gray) and merged images with pMLC. (C) Percentage of cells with transversal actin stress fibers. Error bars, s.e.m. (n=4 except for CCM1+ROCK2 and CCM2+ROCK2 where n=2). (D) Representative immunofluorescence of F-actin (gray) and merged images with VE-cadherin of HUVEC monolayers on 20 μg/ml FN-coated coverslips at 72 h post plating. The asterisk indicates the zone of detachment for intercellular junctions. (E) Quantifications of VE-cadherin thickness from immunofluorescence staining of HUVECs presented as a percentage of control. The CT and CCM1 data are also shown in Fig. 1I. Error bars, s.e.m. (n=4 except for CCM1+ROCK1 where n=3 and CCM1+ROCK2 where n=2). In C and E, *P<0.05, **P<0.005, ***P<0.0005; NS, not significant (one-way ANOVA with Dunett's multiple comparisons). (F) Representative immunofluorescence of F-actin staining and Tg(kdrl:EGFP)-labeled endothelial cells (insets) of the CCV. (G) Quantification dot plot with s.e.m. of the intensity ratios of peripheral cortical actin over intercellular actin in WT (n=13), krit1/ccm1ty219c (16 embryos, 42 cells), krit1/ccm1ty219c+rock1-MO (16 embryos, 47 cells), and WT+rock1-MO (12 embryos, 26 cells) CCV regions; results were normalized to the WT ratio and the experiment was performed three times on independent zebrafish cohorts. ***P<0.005 (one-way ANOVA with Tukey's multiple comparisons post-test). Scale bars: 50 μm (A) 10 μm (B,D,F). CT, control. |
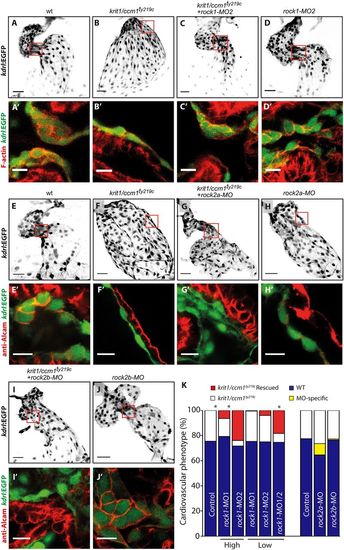
ROCK1 silencing in ccm1 zebrafish mutant embryos rescues cardiac morphogenesis. (A–J) Endocardial cells, marked by Tg(kdrl:EGFP) (inverted images) at 48 hpf. Details with single confocal plane section of the atrioventricular canal (AVC) are shown in A′–J′. Scale bars: 30 µm (main images); 10 µm (detailed images). (K) Quantification of the number of embryos that showed a phenotypic rescue of the krit1/ccm1ty219c cardiac phenotype at 48 hpf. Embryos from krit1/ccm1ty219c/+ incrosses were 75% phenotypically WT (blue bars), while 25% showed krit1/ccm1ty219c mutant phenotype of cardiac ballooning (white bars). Embryos from krit1/ccm1ty219c/+ incrosses that were injected with high doses of rock1-MO1 and -MO2 showed a rescue of the cardiac ballooning (red), whereas embryos injected with low MO doses failed to show significant numbers with rescue. However, when combined, low doses of rock1-MO1 and -MO2 rescued the cardiac ballooning phenotype in krit1/ccm1ty219c mutant embryos as efficiently as single high dose MOs. Total numbers quantified, from a set of three independent zebrafish cohorts, are n=195 for control embryos; rock1-MO1 injected at high dose, n=232; rock1-MO2 at high dose, n=126; rock1-MO1 at low dose, n=167; rock1-MO2 at low dose, n=148; and combined rock1-MO1 and MO2 at low dose, n=134. *P<0.05 (two-way ANOVA with Dunett's multiple comparisons post-test). Embryos from krit1/ccm1ty219c/+ incrosses that were injected with either rock2a-MO1 or rock2b-MO2 did not rescue the cardiac ballooning phenotype, however, a fraction of the sibling population show MO-specific defects that are similar to the krit1/ccm1ty219c phenotype. Control for rock2a-MO, n=230; rock2a-MO, n=265; control for rock2b-MO, n=526; rock2b-MO, n=317. |