
- Title
-
Apical Cell-Cell Adhesions Reconcile Symmetry and Asymmetry in Zebrafish Neurulation
- Authors
- Guo, C., Zou, J., Wen, Y., Fang, W., Stolz, D.B., Sun, M., Wei, X.
- Source
- Full text @ iScience
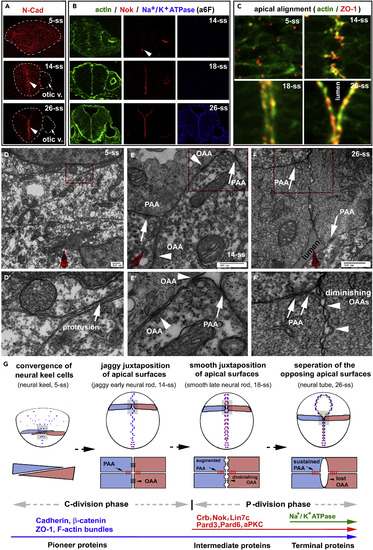
Three-Step Localizations of Apical Polarity Proteins Correlate with the Dynamics of Apical Cell-Cell Adhesions during Zebrafish Neurulation (A) Pioneer proteins N-Cad, visualized by immunohistochemistry, distributed ubiquitously on the cell membranes at 5-ss and then enriched apically (arrowheads) at 14-ss and 26-ss. Arrows, the otic vesicle. (B) Simultaneous staining of F-actin bundles, Nok, and Na+/K+ ATPase at 14-ss, 18-ss, and 26-ss. Note the lack of Nok signals in the neural tissue at 14-ss, except at the ventral end (arrowhead), and the lack of Na+/K+ ATPase apical enrichment at 14-ss and 18-ss. (C) The F-actin bundles and ZO-1 (in the gray areas in G) scattered in the neural keel (5-ss), aligned jaggedly in the early neural rod (14-ss), and aligned smoothly in the late neural rod (18-ss) and the neural tube (26-ss). (D–F and D′–F′) TEM revealed the dynamics of the PAAs and OAAs at the midline region during neurulation: no apparent electron-dense cell-cell junctional complexes in the neural keel at 5-ss (D and D′); apparent electron-dense PAAs (white arrows) and OAAs (white arrowheads) in the jaggy early neural rod at 14-ss (E and E′); and diminishing OAAs and persistent PAAs in the smooth late rod at 18-ss or the neural tube region where apical surfaces still juxtaposed at 26-ss (F and F′). D′–F′ are magnifications of the local regions boxed in D–F, respectively. The red arrows indicate the midline axis, which was defined as the dorsal-ventral central axis of the cross sections of the entire tissues under low magnifications. (G) Diagrams summarize the spatiotemporal localization order of pioneer, intermediate, and terminal proteins; the morphological changes of apical surface alignments; the dynamics of the PAAs and OAAs,; and the switch from cross-midline cell division mode (C-division) to parallel cell division mode (P-division) during the “neural keel-jaggy early neural rod-smooth late neural rod-neural tube” transition. Blue and magenta illustrate neuroepithelial cells of opposite orientations. Also see Figure S1. EXPRESSION / LABELING:
|
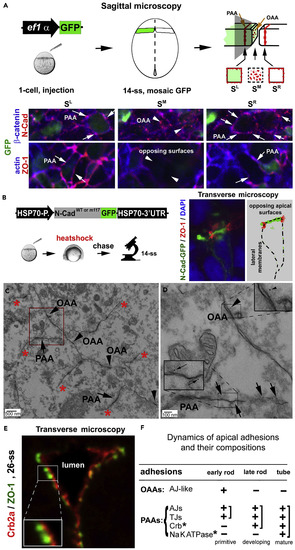
Dynamics and Compositions of the PAAs and OAAs (A) Diagrams illustrate the principle of GFP-assisted sagittal serial microscopy for visualizing proteins at the opposing apical surfaces: the opposing apical surfaces at the midline region (SM), which contain the OAAs, must be flanked by two spatial references—PAA regions of the left and right halves of the tissue (SL and SR). Green represents transiently expressed GFP in some cells. The bottom panels are images collected with this technique: N-Cad and β-catenin were detected at the PAA regions as circumferential belts (SL and SR, arrows) as well as in the OAA regions as punctate foci (SM; arrowheads). By contrast, ZO-1 and actin were detected in the PAA regions (SL and SR, arrows) but not in the OAA regions (SM, arrowheads). (B) Diagrams illustrate the strategy to visualize transiently expressed N-Cadwt-GFP or N-Cadm117-GFP at 14-ss. Note that N-Cadwt-GFP enriched on the opposing apical surfaces (illustrated by the drawing on the right). (C) The PAAs (arrows) and the opposing apical surfaces (arrowheads indicating the OAAs) survived the Triton X-100 extraction of the anti-GFP immunogold electron microscopic procedure, whereas the lateral membranes were dissolved (basal of asterisks). (D) The magnification of the boxed region in C revealed the labeling of N-Cad-GFP with 5-nm gold particles at the PAAs (arrows, 72% of the PAAs were labeled with gold particles) and OAAs (arrowhead). Insets are magnifications of boxed regions. (E) Crb2a juxtaposed with ZO-1 sites at the apical ends (26-ss). (F) The table summarizes the developmental and compositional changes of the OAAs and PAAs. Crb*, Crb-based adhesion; NaKATPase*, Na+/K+-ATPase-based adhesion; +, presence; -, absence. Also see Figure S2. EXPRESSION / LABELING:
|
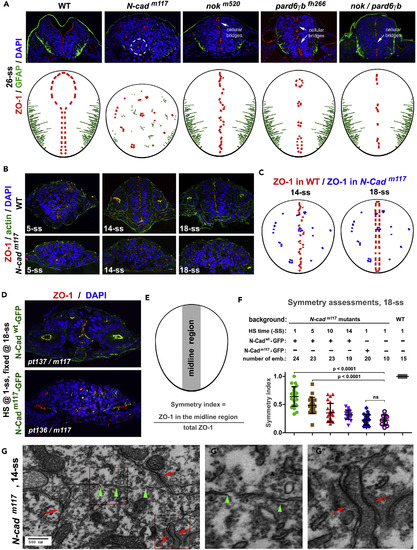
Pioneer Proteins but not Intermediate Proteins Are Required to Establish the Mirror Symmetry of the Neural Tissue (A) In 26-ss N-Cadm117 mutants, apical marker ZO-1 and basal marker GFAP localized ectopically, and cells organized into cellular rosettes (circled by dashed lines), indicating the loss of the mirror symmetry. By contrast, the mirror symmetry remained in 26-ss nokm520, pard6fh266, and nok/pard6γb mutants, despite the presence of cellular bridges (arrows). Top panels, immunohistochemical images; bottom panels, drawings of the distributions of apical and basal markers. (B) ZO-1 did not align at the midline in N-Cadm117 mutants at 14-ss and 18-ss. (C) Drawings contrast the distributions of apical marker ZO-1 in N-Cadm117 mutants (blue) and wild-type embryos (red) at 14-ss and 18-ss. (D) Apical marker ZO-1 localized more frequently in the midline region in N-Cadm117 mutants that expressed N-Cadwt-GFP (in the Tg(HSP70:N-Cadwt-GFP)pt137 transgenic background) than in N-Cadm117 mutants that expressed N-Cadm117-GFP (in the Tg(HSP70:N-Cadm117-GFP)pt136 transgenic background). (E and F) To quantify the effects of rescuing expression of N-Cadwt-GFP (D) on midline distribution of ZO-1, we devised a symmetry index (E), where the midline region is defined as the midline-striding vertical strip of two nuclear diameters wide. (F) Statistical significance was evaluated by one-way ANOVA and Tukey's post hoc analysis. The individual-value bar graphs represent the symmetry indexes of rescued embryos (with means ± SEM). ANOVA, analysis of variance; SEM, standard error of the mean. (G–G″) In N-Cadm117 mutants at 14-ss, the PAA-like structures (red arrows, G″) were detectable under TEM, but no apparent adhesion structures could be identified on the opposing apical surfaces (green arrowheads, G′). G′ and G″ are magnifications of the boxed regions in (G). Also see Figure S3. EXPRESSION / LABELING:
PHENOTYPE:
|
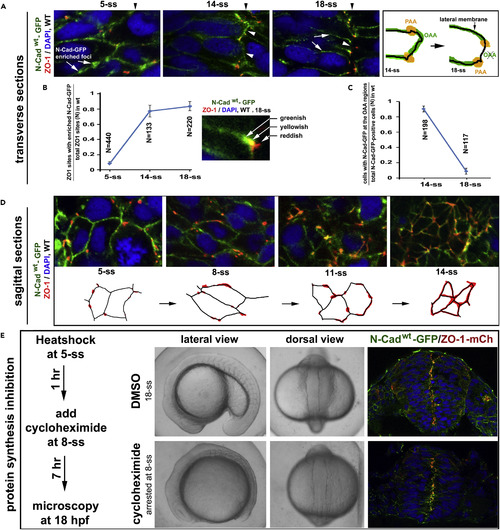
Pioneer Proteins Translocate Apically to Initiate the PAAs and OAAs (A) Dynamic distribution of N-Cadwt-GFP in Tg(HSP70:N-Cadwt-GFP)pt137: at 5-ss, ubiquitously on the cell membrane, with numerous N-Cadwt-GFP-enriched foci; at 14-ss, enriched at the PAAs and on opposing apical surfaces (arrowheads); at 18-ss, enriched at the PAAs and weakly present on the lateral membranes (white arrows), but absent on the opposing apical surfaces (arrowheads; drawings on the right). Black arrowheads indicate the positions of the midline axis. (B) A line graph displays the increase in the ratios between ZO-1 sites that were tightly associated with N-Cadwt-GFP-enriched foci and total ZO-1 sites from 5-ss to 18-ss (8 embryos for each stage; means ± SEM). The inset illustrates the tight association, but not 100% co-localization, between ZO-1 and N-Cadwt-GFP at the PAAs, resulting in greenish, yellowish, and reddish signal appearances. SEM, standard error of the mean. (C) A line graph displays the reduction in the ratios between cells with N-Cadwt-GFP on the opposing apical surfaces and total N-Cadwt-GFP-positive cells from 14-ss to 18-ss (8 embryos for each stage; mean ± SEM). (D) Sagittal imaging revealed that during neural keel-early neural rod transition, ZO-1 signals changed from small punctate sites to circumferential belts (illustrated by drawings). (E) The development of Tg(HSP70:N-Cadwt-GFP)pt137/Tg(HSP70: ZO-1.1-mCherry)pt117b double transgenic embryos was arrested at 8-ss (30 embryos) when treated with protein synthesis inhibitor cycloheximide, but the development proceeded normally to 18-ss (10 embryos) in the 4% DMSO control condition. The scheme illustrates the treatment procedure. In the presence of cycloheximide, N-Cadwt-GFP and ZO-1-mCherry (ZO-1-mCh) still localized to the midline region (compare with N-Cad-GFP and ZO-1 distributions in untreated embryos at 8-ss and 18-ss, Figure S4B). Also see Figure S4. EXPRESSION / LABELING:
|
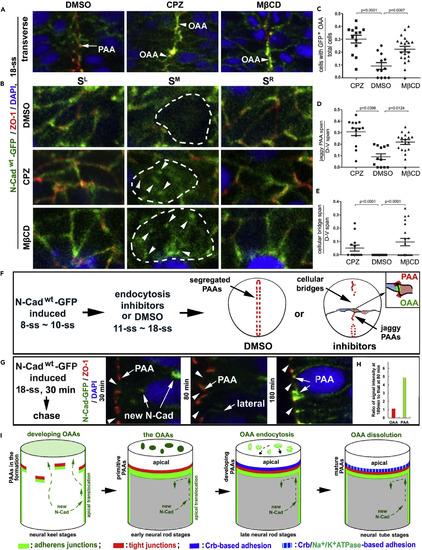
OAA Dissolution Depends on Endocytosis and Restriction of Apical Translocation of N-Cad (A) Effects of treatments with endocytosis inhibitors CPZ (N = 13 embryos) and MβCD (N = 20 embryos) on the apical adhesions in Tg(HSP70:N-Cadwt-GFP)pt137 embryos at 18-ss. Note that inhibition of endocytosis resulted in jaggy midline alignment of ZO-1 and accumulation of N-Cad-GFP at the opposing apical surface (arrowheads); however, in DMSO controls, the PAAs (arrows) segregated into two parallel planes flanking the midline and the OAAs dissolved. Panels are magnifications of the boxed regions in the bottom row of panels in Figure S5F. (B) Serial sagittal imaging of the apical adhesions revealed the retention of the N-Cad-GFP at the OAAs (arrowheads, SM sections) in embryos treated with either CPZ (N = 12 embryos) or MβCD (N = 12 embryos), but not in DMSO control (N = 4 embryos). The opposing apical surfaces are circled with dashed lines. (C–E) Individual-value bar graphs (with means ± SEM) illustrate the ratios between cells displaying N-Cadwt-GFP signals at the OAA region and total cells (C), the ratios between jaggy ZO-1 positive PAA span and dorsal-ventral (D-V) span (D), and the ratios between cellular bridge span and D-V span (E). The numbers of Type I and II embryos analyzed (Figures S5B and S5C) are 13 for CPZ, 20 for MβCD, and 12 for DMSO. p Values by two-tailed Student's t test. (F) A scheme summarizes the treatments and effects described in A–D. (G and H) N-Cadwt-GFP, when heat-shock-expressed for 30 min (starting at 18-ss), first appeared inside the cells 30 min later (arrows new N-Cad), then on the lateral cell membranes 80 min later (arrow lateral), and finally enriched at the PAAs (arrows PAA) 180 min later. Note that N-Cadwt-GFP never localized to the opposing apical surfaces (arrowheads) at any time. The changes of N-Cadwt-GFP signal intensities at the apical regions were quantified as ratios between 180-min chase (N of OAA sites = 59; N of PAA sites = 118) and 80-min chase (N of OAA sites = 45; N of PAA sites = 90); note no changes at the opposing apical surfaces and a five times increase at the PAAs (H). (I) Diagrams summarize the formation of primitive, developing, and mature PAAs, which block the apical translocation of newly synthesized N-Cad from the lateral membranes; the OAAs eventually dissolve by endocytosis. Also see Figure S5. EXPRESSION / LABELING:
PHENOTYPE:
|
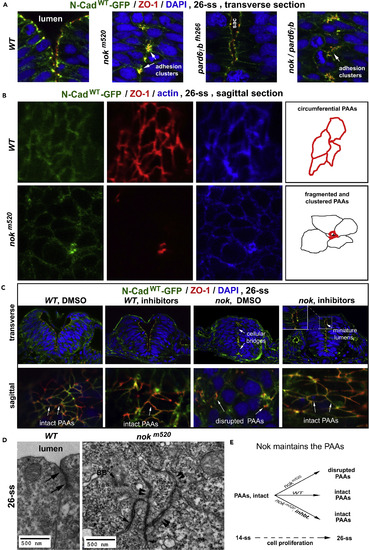
Intermediate Proteins Nok and Pard6 Stabilize the PAAs (A) Transverse imaging: In 26-ss nokm520 single and nokm520/pard6γbfh266 double mutants, ZO-1 and N-Cadwt-GFP aggregated in clusters (arrows) at the midline region, compared with the regular distribution of the PAAs in 26-ss wild-type. In 26-ss pard6γbfh266 mutants, the PAAs contoured small luminal sacs. (B) Sagittal imaging: As summarized by the drawings on the right, in 26-ss wild-type embryos, ZO-1 and N-Cadwt-GFP enriched at the PAAs as circumferential belts; by contrast, in 26-ss nokm520 mutants, ZO-1 and N-Cadwt-GFP clustered at the corners of the cells, indicating the loss of PAA integrity. (C) ZO-1 and N-Cadwt-GFP distributions (top panels, transverse imaging; bottom panels, sagittal imaging) in DMSO-treated and DNA-synthesis-inhibitor-treated wild-type and nokm520 mutants (6 wild-type and 12 mutant embryos for each condition). Note that inhibitor treatment of nokm520 mutants restored intact PAAs and miniature lumens (inset, arrow miniature lumens) and prevented cellular bridges (arrows cellular bridges). (D) TEM: Unlike in wild-type, where the PAAs sealed the paracellular clefts near the lumen (arrows), cell-cell junctional complexes clustered at membrane protrusions in nokm520 and indiscriminately adhered cells from both sides together at 26-ss (double arrowheads). Arrow BB, basal body. (E) A scheme depicts that Nok is required to maintain the PAAs during cell proliferation. Inhbt., DNA synthesis inhibitors. Also see Figure S6. EXPRESSION / LABELING:
PHENOTYPE:
|
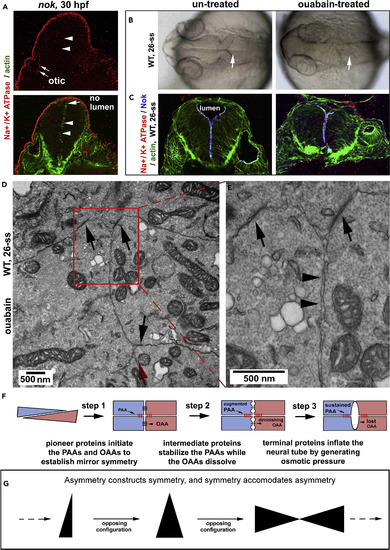
Terminal Protein Na+/K+-ATPase Is Required for Luminal Inflation but Not for OAA Dissolution (A) In 30-hpf nokm520 mutants, Na+/K+-ATPase α failed to enrich at the midline region in the neural tissue (arrowheads) but still enriched in the otic vesicle (arrows). (B) Brain ventricle inflation was blocked by ouabain treatment (arrows; 26-ss). (C) Ouabain did not prevent Na+/K+-ATPase α from enriching apically with Nok in the neural tissue (26-ss). (D and E) TEM revealed that in ouabain-treated embryos, the PAAs persisted (black arrows), whereas the OAAs were not detectable on the opposing apical cell membranes (arrowheads). (E) Magnification of the boxed region in (D). The red arrow indicates the midline direction. (F) Diagrams summarize that pioneer, intermediate, and terminal proteins regulate zebrafish neurulation through the three steps. (G) A diagram illustrates the three core elements that underlie symmetry formation: symmetry, asymmetry, and opposing configuration. Also see Figure S7. EXPRESSION / LABELING:
PHENOTYPE:
|
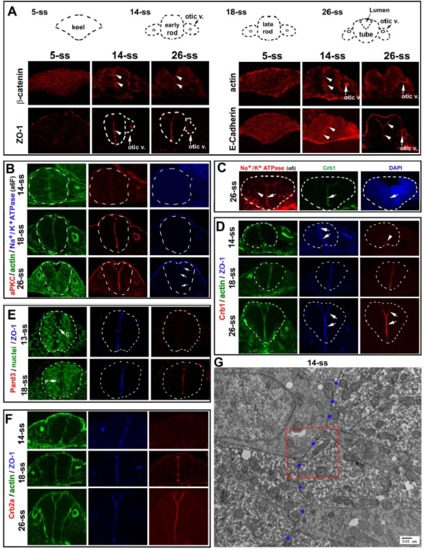
Apical polarity proteins localize or enrich in a stepwise fashion at the apical surfaces in rhombomeres 5 and 6 during neurulation A. As revealed by immunohistochemistry, E-Cadherin, -catenin, and F-actin localized broadly to the entire cell membranes at 5-ss, and then enriched apically at 14-ss and 26-ss. At 26-ss, E Cadherin signals in the dorsal region of the neural tube and the otic vesicle were stronger than those in the mid-ventral regions. ZO-1 initially scattered as small punctate sites at 5-ss and later enriched apically (14-ss, 26-ss). Arrowheads point at the apical surfaces; arrows otic v. point at the otic vesicles. Note that it is unknown to what extent the E-Cadherin immunostaining signals represented P-Cadherin because the E-Cadherin antibody cross-reacts with P-cadherin (http://www.bdbiosciences.com/ds/pm/tds/610182.pdf). B. Simultaneous immunostaining of Factin bundles, aPKC, and Na+/K+ ATPase (with the a6F antibody) at 14-ss, 18-ss, and 26-ss. Note the lack of aPKC staining at 14-ss as well as Na+/K+ ATPase staining at 14-ss and at 18-ss. C. Apical enrichment of Na+/K+ ATPase α (with weak lateral membrane staining) at 26-ss was also confirmed with the a5 antibody. Note that all other Na+/K+ ATPase α images in this study were visualized with the a6F antibody. D. Simultaneous immunostaining of ZO-1, F-actin, and Crb1 at 14-ss, 18-ss, and 26-ss. Note the lack of Crb1 staining at 14-ss, except at the very ventral end (arrowhead). E. Simultaneous immunostaining of ZO-1 and Pard3, counterstained with nuclear dye DAPI (blue). Note the lack of Pard3 signals at 13-ss. Arrow C indicates a cell going through a C-division at 13-ss when Pard3 was not detectable; arrow P indicates a cell going through a P-division at 18-ss when Pard3 became detectable at the apical surfaces. F. Simultaneous immunostaining of F-actin bundles, ZO-1, and Crb2a. Note the lack of Crb2a at 14-ss. G. A TEM image at a lower magnification illustrates the apical surfaces (marked by blue dots) juxtaposed at the midline. The boxed area was magnified in Figure 1E. |
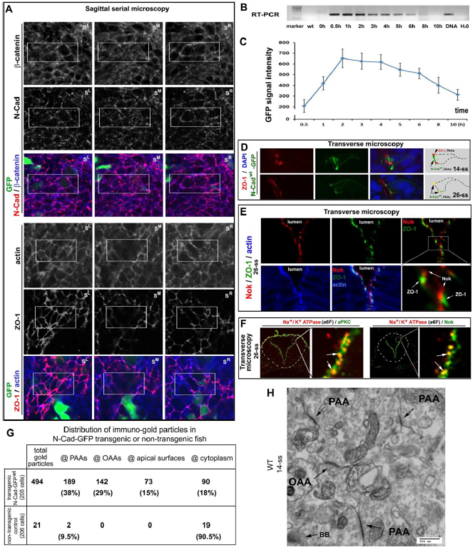
The development of the PAAs and OAAs and their dynamic molecular compositions A. GFP-assisted sagittal serial microscopy revealed that N-Cad and -catenin but not ZO-1 or actin localized to the opposing apical surfaces. The boxed areas are presented in Fig. 2A at higher magnifications. B. An RT-PCR revealed that the mRNA products of the N-Cadwt-GFP transgene reached its highest level 30 min after a heat shock and disappeared completely by 10 hours after the heat shock. C. The N-Cadwt-GFP fluorescence intensities of whole embryos reached the highest level 2 hours after the heat shock, and fell by 77% 10 hours after the heat shock. The fluorescence intensities were measured with Q-imaging under a stereo-fluorescence scope (ten embryos; means ± SEM). D. Single channel and merged images of Fig. 2B are presented to better illustrate the distributions of N-Cadwt-GFP to the PAAs and OAAs; N-Cadwt GFP was transiently-induced by heat shock from a transgenic construct injected into the embryos. Note that N-Cadwt-GFP enriched at both the PAAs and OAAs at 14-ss, but only at the PAAs at 26-ss. Weaker N-Cadwt-GFP signals persisted on the lateral membranes. The drawings summarize the distributional dynamics of ZO-1 and N-Cad-GFP. E. Nok, a cytoplasmic partner of Crb proteins, closely associated with the apical side of ZO-1 sites. F. Na+/K+ ATPase colocalized with aPKC and Nok at 26 ss (arrows), although Nok and aPKC distributed more broadly than Na+/K+ ATPase did. G. The table presents the subcellular distributions of immuno-EM gold particles in the early neural rods (at 14-ss) of N-Cad-GFPwt-expressing transgenic embryos and non-transgenic wildtype control embryos: The numbers of gold particles (as well as their corresponding percentages in total particles) distributed at the PAAs, OAAs, opposing apical surface, and cytoplasm are tabulated. Note the enrichment of gold particles at the OAAs and PAAs in N-Cad-GFPwt-expressing embryos but not in wildtype control embryos. H. An immuno-EM micrograph of the midline region of a wildtype neural rod revealed that the PAAs and OAAs survived the Triton X-100 extraction of the staining procedure and that no gold particles were observed at the PAAs and OAAs. |
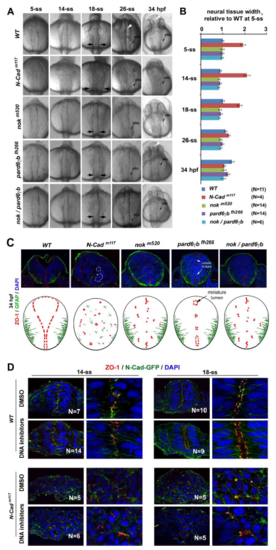
Loss of pioneer protein N-Cad and intermediate proteins Nok and Pard6b prevented neural tube lumen formation and affected the mirror symmetry of the neural tissue A. Dorsal views of the neural tissues of wildtype, N-Cadm117, nokm520, pard6γbfh266, and nokm520/pard6γbfh266 embryos during neurulation. At 26-ss and 34 hpf (hours post-fertilization), the lumen was apparent in wildtype (white arrowhead) but not in mutants. B. Bar graphs illustrate that the neural tissue of N-Cadm117 mutants was 170% to 200% wider than wildtype and other mutants (measured from 5-ss to 18-ss at the otic vesicle regions marked by the opposing black arrows in A; means ± SEM; N numbers, measured embryos). C. At 34 hpf, apical marker ZO-1 localized ectopically in nokm520 single (6 embryos) and nokm520/pard6γbfh266 double mutations (7 embryos), although the basal marker GFAP appeared to localize properly; in pard6γbfh266 (6 embryos), apical marker ZO-1 continued localizing to the midline region and demarcated the boundaries of miniature lumens (black arrow); finally, in N-Cadm117 (20 embryos), the mirror symmetry of the neural tissue remained disrupted at 34 hpf, and cells aggregated into rosettes (two rosettes are marked with dashed lines). The drawings summarize the distributions of the apical and basal markers at 34 hpf. D. Effects of inhibiting cell division with DNA synthesis inhibitors (from 1-ss to 18-ss) on the distribution of apical markers ZO-1 and N-Cad-GPF in wildtype and N-Cadm117 at 18-ss. Note that in wildtype, apical markers localized in a jaggy line at the midline region at 14-ss and then separated into two parallel lines at 18-ss; by contrast, in N-Cadm117, apical markers scattered throughout the tissue at both 14-ss and 18-ss, whether treated with the inhibitors or not. N numbers are numbers of embryos examined for each condition. Left panels are lower magnifications, right panels are higher magnifications. |
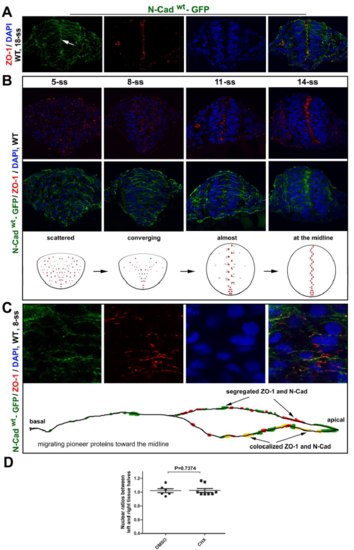
ZO-1 and N-Cadwt-GFP translocate apically during neural keel-neural rod transition in Tg(HSP70:N-Cadwt-GFP)pt137 A. Distributions of N-Cadwt-GFP and ZO-1 in the neural rod at 18-ss were revealed by immunohistochemistry of the transverse tissue sections. Note the apical enrichment of both proteins (arrows). N-Cadwt-GFP was briefly induced by a heat shock at 10-ss. B. Transverse imaging at 5-ss, 8-ss, 11-ss, and 14-ss: ZO-1 first localized to small punctate sites and then enriched at the midline region, whereas N-Cadwt-GFP distributed broadly on the cell membranes and then enriched at the midline region. Diagrams summarize the dynamics of ZO-1 distributions. C. A higher magnification to better reveal that ZO-1 foci, which were often closely associated with N-Cadwt-GFP, became more concentrated in the apical half of the cells at 8-ss and localized to larger and more elongated spots than at earlier stages. The bottom diagram depicts the distribution of ZO-1 and N-Cadwt-GFP on the cell membrane. D. Individual-value bar graphs (means ± SEM) show that the cycloheximide (CHX) treatment (see the protocol in Fig. 4E) did not affect the nuclear ratios between the left and right halves of the neural tissue. Numbers of embryos analyzed: 6 DMSO-treated; 8 CHX-treated. P values by two-tailed t test. |
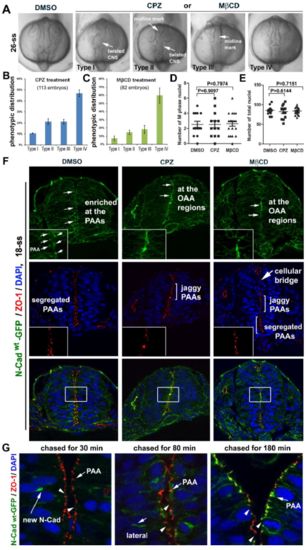
Endocytosis is required for OAA dissolution A-C. Endocytosis inhibitors CPZ and MCD blocked lumen formation and caused the neural tissue to twist to various degrees, as classified into Type I – IV categories. The cause of the phenotypic variations is unclear, but we speculate that embryos responded to the drugs differently due to variations in their genetic background, despite the fact that they were all TU fish. Histograms represent the frequency distribution of the four categories (from three experiments of a total of 113 embryos treated with PCZ, 82 embryos treated with MCD, and 50 control embryos treated with DMSO; means ± SEM). D. The average numbers of dividing nuclei per section (by counting M-phase nuclei revealed by DAPI staining) did not vary among embryos treated with DMSO (12 embryos), CPZ (13 embryos), and MβCD (20 embryos). E. The average total numbers of nuclei per section did not vary among embryos treated with DMSO (12 embryos), CPZ (13 embryos), and MβCD (20 embryos). F. The effects of endocytosis inhibitors CPZ and MβCD (from 11-ss to 18-ss) on the apical adhesions in Tg(HSP70:N-Cadwt-GFP)pt137 embryos at 18-ss. Note that the inhibition of endocytosis resulted in jaggy midline alignment of ZO-1 and N-Cad-GFP, which were sometimes disrupted by cellular bridges; however, in DMSO controls, the PAAs segregated into two parallel planes flanking the midline, where the OAAs dissolved. Insets, magnifications of the boxed regions in the top and middle panels; the boxed regions in the bottom panels were presented at higher magnifications in Figure 5A. G. The images show the tissue regions from which local apical areas were magnified and presented in Figure 5G, which illustrates the fate of N-Cadwt-GFP that was briefly induced at 18-ss. Again, note that N-Cadwt-GFP first concentrated in some intracellular regions (30 min), then localized to the lateral membrane (80 min), and finally enriched at the PAAs (arrows; 180 min); however, at no time did N-Cadwt-GFP localize to the OAA regions (arrowheads). |
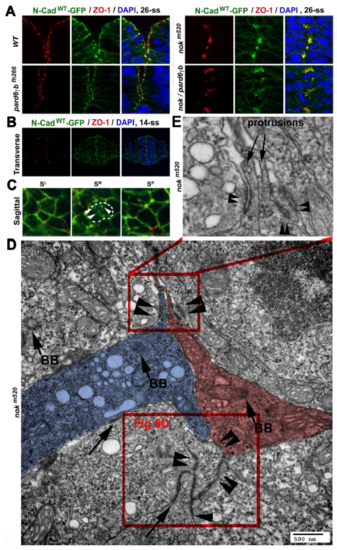
Intermediate proteins maintain PAA integrity and specificity A. Single channel images of Figure 6A illustrate the distribution of ZO-1 and N-Cadwt-GFP in wildtype, nokm520, pard6γbfh266, and nokm520/pard6γbfh266 mutant embryos at 26-ss. B. Transverse confocal imaging of 21 siblings of nokm520 heterozygous parents revealed no difference in the apical distributions of ZO-1 and N-Cad-GFP at 14-ss. (Please note that unlike at 18-ss or later, nokm520mutants do not display apparent phenotypes at 14-ss for easy genotyping. Thus, we decided to infer whether nok mutation affects the OAAs and PAAs at 14-ss by examining over 20 embryos, of which about five embryos were expected to be nokm520 mutants.) C. Sagittal confocal imaging of 22 siblings of nokm520 heterozygous parents confirmed the punctate N-Cad- GFP-positive OAAs (arrowheads) in the midline plane (SM) at 14-ss in all embryos examined. D, E. A TEM image shows the distributions of cell-cell adhesions at the midline region. Cell-cell adhesions assembled cell protrusions in plywood-like clusters (double arrowheads). Two neuroepithelial cells, highlighted with blue and magenta, opposed at their apical ends, which are indicated by the apical marker basal bodies (arrows BB). The lower boxed region in B is magnified in Figure 6D; the upper boxed region is enlarged in C to better illustrate the plywoodlike clustering of cell protrusions that were adhered together by cell-cell adhesions (double arrowheads). |
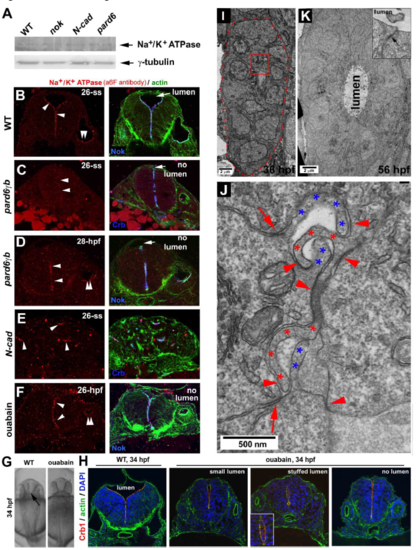
Terminal protein Na+/K+ ATPase is required to inflate the neural tube lumen, and the gut development also follows a rod-tube transition A. Western blotting revealed that Na+/K+ ATPase α1 was expressed at 26-ss in nokm520, N-Cad, and pard6γbfh266 mutants as in wildtype. B. Na+/K+ ATPase α co-localized with Nok at the apical surfaces in wildtype at 26-ss. C-D. Na+/K+ ATPase α localized apically in pard6γbfh266 mutants at 28 hpf but not yet at 26-ss. E. In N-Cad mutants, Na+/K+ ATPase α localized to the central miniature lumen of neural cellular rosettes at 26-ss. F. Ouabain treatment did not prevent Na+/K+ ATPase α from localizing apically but did prevent the lumen from inflating. G. Dorsal view of the brain ventricles (arrow) in 34-hpf wildtype but not in ouabain-treated embryos. H. Ouabain treatment from 1-ss to 34 hpf: Crb1 and actin localized normally at the apical ends of the neural tubes (transverse sections) in wildtype (9 embryos) and in ouabain-treated embryos (30 embryos); however, ouabain-induced three defects in the lumen: small lumen (6 out of 30), stuffed lumen (stuffed with cells, inset; 4 out of 30), and no lumen (20 out of 30). I. At 36 hpf, the gut epithelial cells organized into a rod. The red-dashed line demarcates the outer boundary of the gut rod. J. A boxed region in panel I is enlarged to better show the hook-like interlocking apical membrane protrusions of gut rod cells (red and blue asterisks). These hook-like apical protrusions are presumably the microvilli, and they were adhered together with adhesions (arrowheads) to join opposing cells together. In addition, the parallel apical adhesion complexes (arrows) adhered together neighboring cells of the same orientations. K. At 56 hpf, the gut tissue developed into a hollow tube. Microvilli were no longer interlocked with each other via opposing adhesions, and a lumen emerged. However, the parallel apical adhesion persisted (inset, arrow). |