
- Title
-
Hypothalamic Projections to the Optic Tectum in Larval Zebrafish
- Authors
- Heap, L.A., Vanwalleghem, G.C., Thompson, A.W., Favre-Bulle, I., Rubinsztein-Dunlop, H., Scott, E.K.
- Source
- Full text @ Front. Neuroanat.
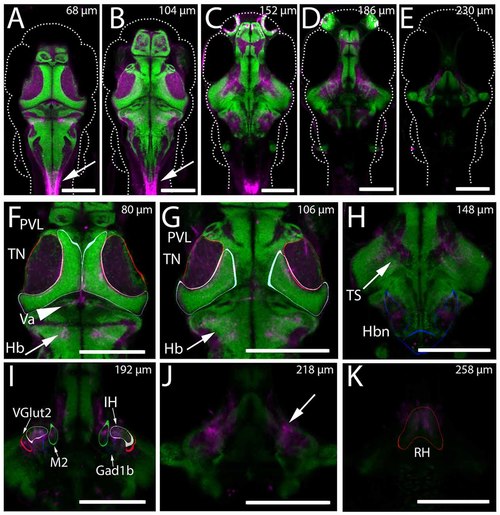
Expression of Kaede in the Gal4s1113t ET line. (A–K) The mean intensity, resulting from registering and averaging the expression pattern across nine animals, of the genotype Gal4s1113t;UAS:Kaede is shown in magenta, overlaid with a pan-neuronal (HuC) H2B-RFP label (green). (A–E) Whole brain images at five dorsal-ventral depths separated by 15–21 microns. Arrows in (A,B) indicate expression in the spinal cord of these animals. (F) In the dorsal brain, Gal4s1113t axons are present in the tectal neuropil (TN; red outline), tectal periventricular layer (PVL; cyan outline), valvula (Va) cerebellum (arrowhead) and hindbrain (Hb; arrow). (G) Axonal expression in the tectal neuropil (red outline) and sparse expression is seen in tectal periventricular neurons (cyan outline). Axons are present in the hindbrain (arrows). (H) Further ventral, expression is seen in the neuropil areas medial to the torus semicircularis (arrow) and in hindbrain neuropil (Hbn) regions (blue outline). (I) Axonal expression in the diffuse nucleus of the intermediate hypothalamus (IH; gray outline), a hypothalamic Gad1b cluster (blue outline) and hypothalamic Vglut2 cluster (red outline), and the migrated posterior tubercular area (M2; green outline). (J) Axonal labeling (arrow) of neurons with cell bodies located in the rostral hypothalamus (RH; outlined in red in K). Scale bars equal 200 μm. |
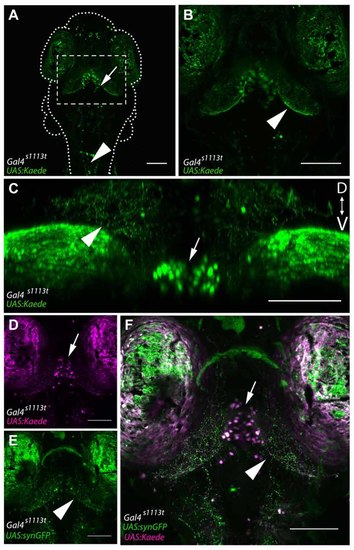
Gal4-positive hypothalamic neurons project axons to the tectal neuropil. (A) Maximum projection of a 6 dpf Gal4s1113t;UAS:Kaede larva in which expression is strongest in a small number of neurons in the ventral diencephalon, located in the RH (arrow). (B) shows a closeup of the box in (A). Neurites are evident in the tectal neuropil (arrowhead) suggesting that hypothalamic projections may be targeting the tectum. (C) A coronal rotation through an animal with the genotype Gal4s1113t;UAS:Kaede. The location of labeled cell bodies is indicated with an arrow, and projections to the tectal neuropil are labeled with an arrowhead. (D,E) Images from a Gal4s1113t;UAS:Kaede, UAS:syn-GFP showing the cell bodies of the RH neurons with photoconverted red Kaede (arrowhead, D) and the green presynaptic terminals of their axons in the tectal neuropil (arrow, E). These channels are merged in (F). Scale bars equal 100 μm. |
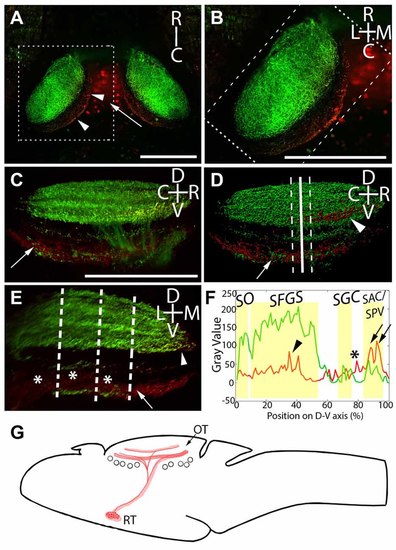
Laminar structure of hypothalamic projections in the tectal neuropil. By expressing UAS:Kaede under the control of Atoh7:Gal4 and Gal4s1113t, we have identified the neuropil laminae targeted by hypothalamic projection neurons. (A) Maximum intensity projection of a single larva at 20× magnification, showing red photoconverted cells in the hypothalamus (arrow), as well as their neurites in the tectal neuropil (arrowheads). (B) An expanded view of the box in (A), showing the relative positions of the retinal ganglion cells (RGC; green) and RH (red) axons. (C) A rotated view of the box in (B), with the medial edge of the neuropil perpendicular to the field of view. The arrow indicates hypothalamic axons in the stratum album centrale (SAC)/stratum griseum periventriculare (SPV). (D) An Imaris 3D rendering of (C). The solid line indicates the medial-lateral center point of the tectal neuropil, and dashed lines show the boundaries that were used in creating the coronal perspective in (E). The arrow indicates hypothalamic output to the SAC/SPV, arrowhead indicates hypothalamic output in the stratum fibrosum et griseum superficiale (SFGS). (E) A coronal perspective of the tectal neuropil labeling all laminae formed by the RGC axons (green) and hypothalamic inputs (red). To assess which sublaminae of the neuropil the hypothalamus targets, the fluorescent intensities of retinal and hypothalamic inputs were sampled at three evenly-spaced positions, indicated by dashed lines. (F) Hypothalamic inputs specifically targeted regions of the SFGS (arrowhead) and SAC/SPV (arrows) in the tectal neuropil. Additionally, hypothalamic projections frequently targeted a lamina devoid of retinal input between the stratum griseum centrale (SGC) and SAC/SPV (asterisks, E,F). Scale bar represents 100 μm. (G) A schematic of the projection from the RH to the optic tectum in the Gal4s1113t transgenic line. |
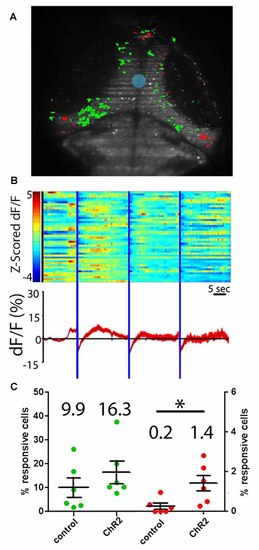
Hypothalamic projection neurons deliver inhibitory inputs to the tectum. (A) Activation of ChR2-expressing neurons in the RH using sculpted blue light (shaded blue) results in inhibitory responses (shaded red) and excitatory visual responses (green) in tectal PVL neurons. (B) A raster plot of these responses (n = 46 inhibited neurons across six larvae) shows the z-scored ∆F/F of these inhibited neurons (top), and an average trace of these neurons through the experiment is shown (bottom). (C) Similar proportions of tectal cells were excited by a short pulse of blue light in ChR2+ larvae and ChR2− controls, indicating that these are direct visual responses (green). Significantly more tectal neurons were inhibited in ChR2+ larvae vs. ChR2− controls (red) by a prolonged illumination of the RH, indicating a causative effect of hypothalamic inputs. Dots represent individual larvae and mean ± SEM is indicated, mean value is reported above each scatter plot. *p < 0.05. n = 6 experimental, n = 6 controls. |