
|
Fig. 1
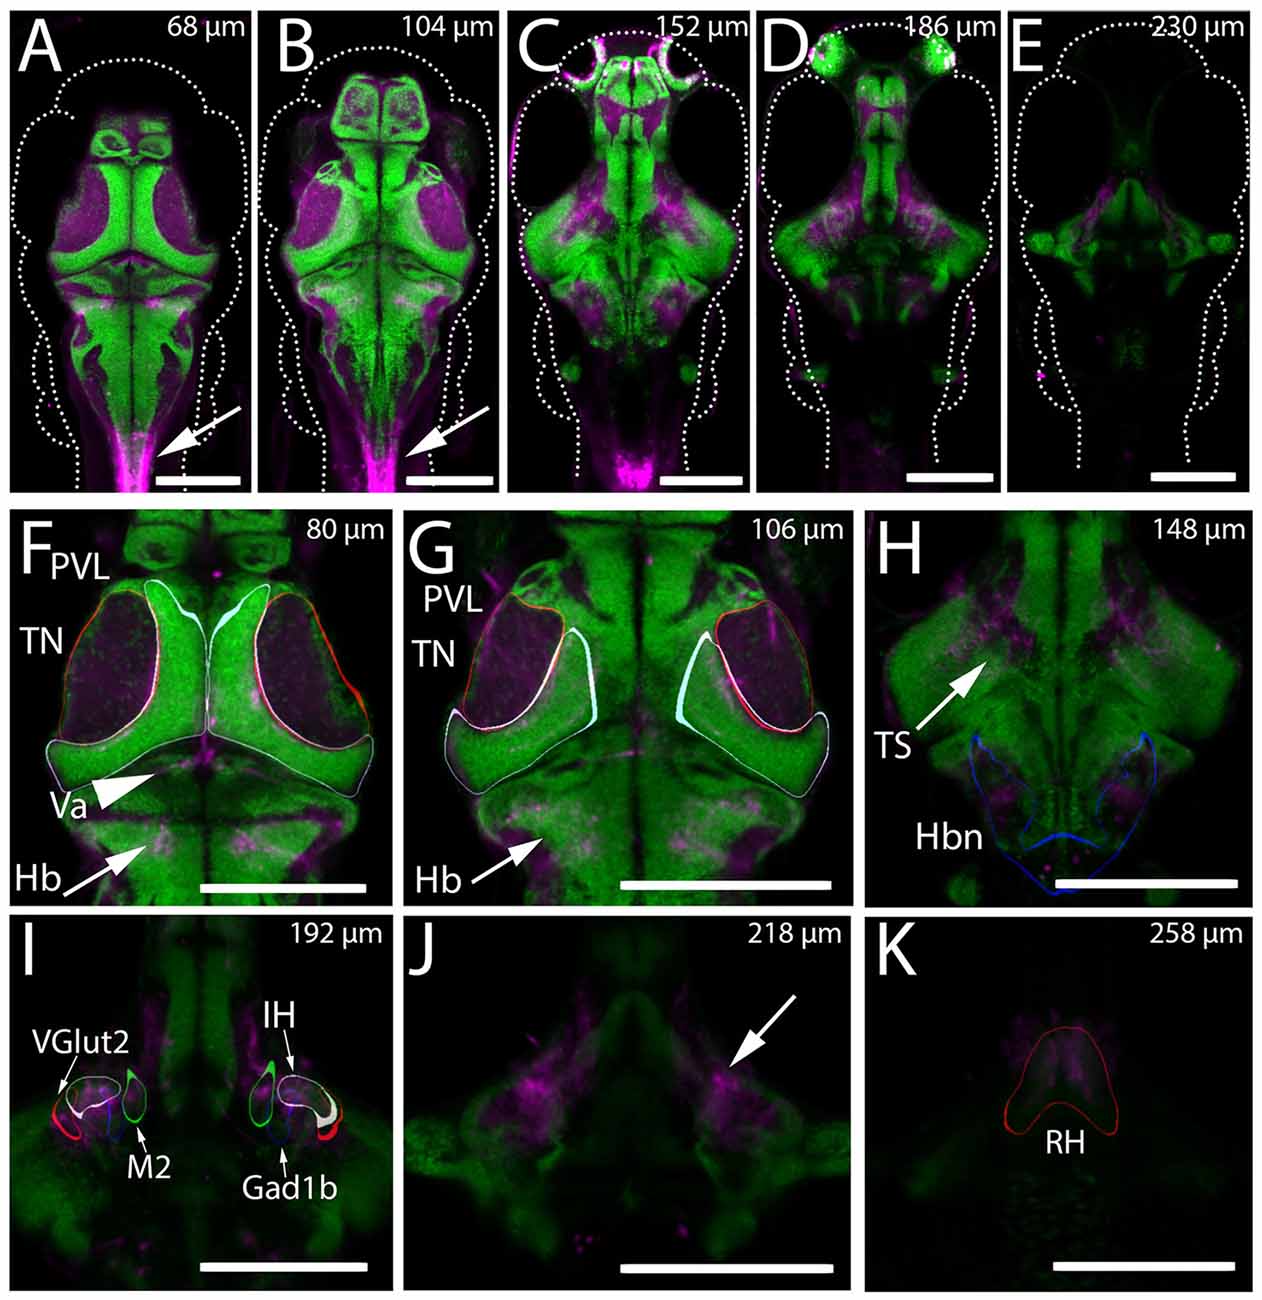
Expression of Kaede in the Gal4s1113t ET line. (A–K) The mean intensity, resulting from registering and averaging the expression pattern across nine animals, of the genotype Gal4s1113t;UAS:Kaede is shown in magenta, overlaid with a pan-neuronal (HuC) H2B-RFP label (green). (A–E) Whole brain images at five dorsal-ventral depths separated by 15–21 microns. Arrows in (A,B) indicate expression in the spinal cord of these animals. (F) In the dorsal brain, Gal4s1113t axons are present in the tectal neuropil (TN; red outline), tectal periventricular layer (PVL; cyan outline), valvula (Va) cerebellum (arrowhead) and hindbrain (Hb; arrow). (G) Axonal expression in the tectal neuropil (red outline) and sparse expression is seen in tectal periventricular neurons (cyan outline). Axons are present in the hindbrain (arrows). (H) Further ventral, expression is seen in the neuropil areas medial to the torus semicircularis (arrow) and in hindbrain neuropil (Hbn) regions (blue outline). (I) Axonal expression in the diffuse nucleus of the intermediate hypothalamus (IH; gray outline), a hypothalamic Gad1b cluster (blue outline) and hypothalamic Vglut2 cluster (red outline), and the migrated posterior tubercular area (M2; green outline). (J) Axonal labeling (arrow) of neurons with cell bodies located in the rostral hypothalamus (RH; outlined in red in K). Scale bars equal 200 μm.