
- Title
-
Glucocorticoids promote Von Hippel Lindau degradation and Hif-1α stabilization
- Authors
- Vettori, A., Greenald, D., Wilson, G.K., Peron, M., Facchinello, N., Markham, E., Sinnakaruppan, M., Matthews, L.C., McKeating, J.A., Argenton, F., van Eeden, F.J.M.
- Source
- Full text @ Proc. Natl. Acad. Sci. USA
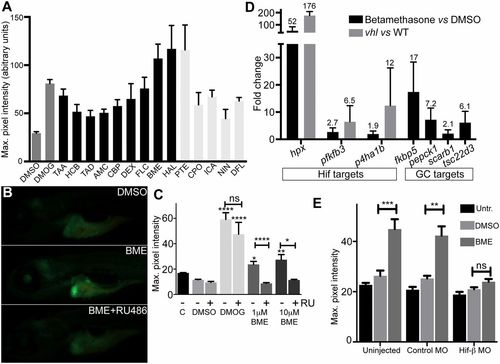
Identification of glucocorticoids as HIF activators. (A) Retest of hits from the Spectrum screen for activators of the HIF response in phd3:eGFP zebrafish, where compounds showing an average GFP level of >44 are shown. Averaged maximum pixel intensity and SEM are shown for between five and nine embryos. Dark gray: controls; black: GC-like compounds; light gray: non-GC hits. AMC, amcinonide; BME, betamethasone; CBP, clobetasol propionate; CPO, ciclopirox olamine; DEX, dexamethasone; DFL, 8,2-dimethoxyflavone; FLC, fluocinonide; HAL, halcinonide; HCB, hydrocortisone butyrate; ICA, icariin; NIN, 7-nitroindazole; PTE, ptaeroxylin; TAA, triamcinolone acetonide; TAD, triamcinolone diacetate. (B) BME activates phd3:eGFP in an RU-486–dependent manner; representative images show the activation specific to the liver in BME-treated embryos and reduced GFP expression following BME+RU-486 cotreatment. (Magnification: 16×.) (C) Quantitation of phd3:eGFP response. DMSO was added to 1% vol/vol in all experiments except Control (C), DMOG to 60 μM, and RU-486 to 5 μM as indicated (n ≥ 9). (D) BME induction of hypoxia-regulated genes and GC target genes, where values above bars indicate average fold change (FC) and triplicate samples of 20 embryos were used. For the hypoxia-induced genes, FC induction in vhl mutants vs. wild type is given as a comparison, where FC is calculated using ΔΔCT ± SEM. (E) HIF1β-MO abrogates BME activation of phd3:eGFP. Maximum pixel intensity in embryos as grouped by injection showing mean ± SEM (n = 14). Significance was calculated using Kruskal–Wallis one-way ANOVA followed by Dunn’s multiple comparison test for treatments against DMSO (*P < 0.05; **P < 0.01; ***P < 0.001; ****P < 0.0001). EXPRESSION / LABELING:
PHENOTYPE:
|
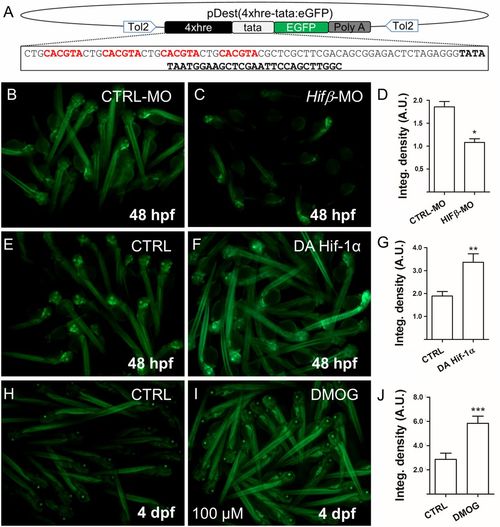
Generation of 4xhre-tata Hif-reporter lines. (A) Schematic representation of the Tol-2 vector used to generate the Tg(4xhre-tata:eGFP)ia21 line. The construct consists of a 98-bp fragment encoding four HREs (in red) from the murine lactate dehydrogenase followed by a TATA minimal promoter (in boldface), EGFP (in green), and the poly(A) signal. (B–D) Representative image of Tg(4xhre-tata:eGFP)ia21 embryos at 48 hpf injected with a control MO (B) or the HIFβ-MO MO (C). (Magnification: 5×.) Down-regulation of Hifβ significantly decreases transgene activity as reported by the integrated density analysis of fluorescence (D). (E–G) HIf-1α dominant active (DA) mRNAs injected in Tg(4xhre-tata:eGFP)ia21 embryos increase transgene expression (F) compared with control embryos (E). (Magnification: 5×.) (H–J) Treatment from 72 hpf to 96 hpf with 100 μM DMOG significantly increases 4xhre-tata transgene activity (I) with respect to the control embryos (H). (Magnification: 4×.) (D, G, and J) Average values of fluorescence integrated density calculated for treated embryos and controls. Values represent the mean ± SEM (***P < 0.001; **P < 0.01; *P < 0.05). A.U., arbitrary units. |
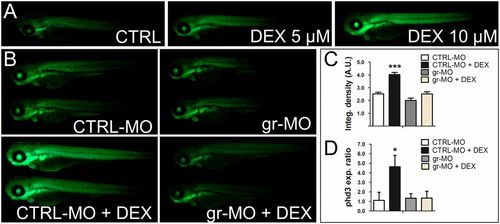
Cross-talk between the HIF-1 and glucocorticoid-signaling pathways is mediated by the glucocorticoid receptor and HREs. (A) The 72-hpf Tg(4xhre-tata:eGFP)ia21 embryos were incubated with different concentrations of DEX. DEX activates the 4xhre-tata transgene. (Magnification: 8×.) (B) Images of 72-hpf Tg(4xhre-tata:eGFP)ia21 larvae injected with a gr-MO and a CTRL-MO alone or combined with DEX (Bottom). DEX activation of 4xhre-tata transgene expression is maintained in CTRL-MO–injected larvae and ablated in GR morphants. (Magnification: 8×.) (C) Histograms showing the average values (±SEM) of the fluorescence-integrated density in 72-hpf Tg(4xhre-tata:eGFP)ia21 embryos injected with gr-MO and CTRL-MO with or without DEX. A.U., Arbitrary units. (D) Fold changes (±SEM) in phd3 gene expression in 72-hpf embryos injected with gr-MO and CTRL-MO with or without DEX (24 h) compared with nontreated/noninjected controls (set at 1). Target gene mRNA levels were normalized to β-actin. *P < 0.05; ***P < 0.001. EXPRESSION / LABELING:
PHENOTYPE:
|
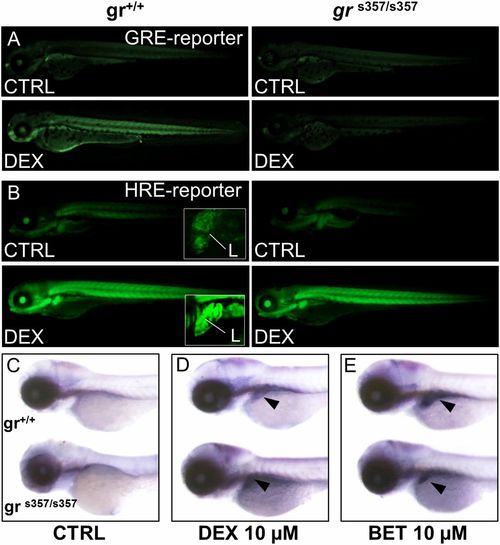
Glucocorticoid induction of HIF-1 activity is independent of glucocorticoid receptor DNA binding. (A) Treatment with 10 μM DEX for 24 h activates the wild-type Tg(9xGCRE-HSV.Ul23:eGFP)ia20 (23) glucocorticoid reporter (GRE-reporter) line, while in grs357 mutant background (Right) DEX is unable to activate GRE reporter. (Magnification: 14.5×.) (B) Images of wild-type and grs357 embryos in the Tg(4xhre-tata:eGFP)ia21 background (HRE-reporter), treated for 24 h with DEX 10 µM. DEX activates the 4xhre-tata transgene in both wild-type and grs357 mutant larvae and induces a significant and generalized increase of fluorescence that is particularly evident in the liver (L in Insets). (Magnification: 14.5×; Insets, 72.5×.) (C–E) In situ hybridization of phd3 mRNA antisense probe in wild-type and grs357 mutants at 80 hpf. (Magnification: 17.5×.) DEX (D) or BME (E) activated phd3 gene expression in the liver (arrowheads). EXPRESSION / LABELING:
PHENOTYPE:
|
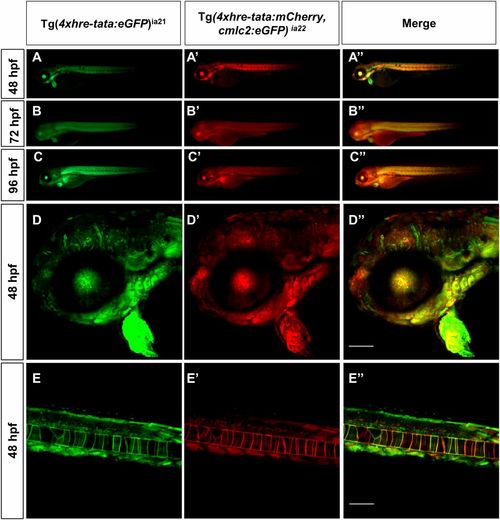
HRE transgene expression: Tg(4xhre-tata) lines have overlapping expression patterns. Conventional (A, A′, A′′, B, B′, B′′, C, C′, and C′′) and confocal (D, D′, D′′, E, E′, and E′′) lateral views of double transgenic Tg(4xhre-tata:eGFP)ia21/Tg(4xhre-tata:mCherry,cmlc2:eGFP)ia22 embryos. (D, D′, D′′, E, E′, and E′′) The 48-hpf embryos, with anterior to the left. (D–D′′) Head region of double transgenic embryo: D, green channel; D′, red channel; D′′, merge. (E–E′′) Tail region of double transgenic embryo: E, green channel; E′, red channel; E′′, merge. (Scale bar: 100 μm.) Comparisons between the two reporter lines revealed significant overlap in the expression profile of the 4xhre-tata transgene, suggesting the independence of the transgene expression from the genomic site of insertion. (Magnification: A–C, 8×.) |
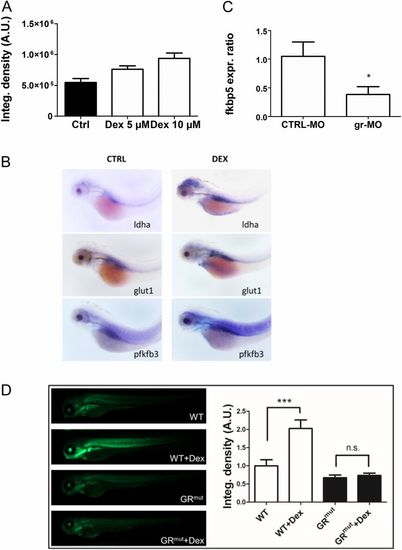
DEX induces Hif-1 pathway activation and expression of glycolytic regulators and is GR-dependent. (A) Histograms showing the average values of the integrated density of fluorescence in 72-hpf Tg(4xhre-tata:eGFP)ia21 embryos treated with different doses of DEX. DEX incubation induces a dose-dependent activation of the Hif-1 pathway as shown by the increase of the 4xhre-tata transgene expression. A.U., arbitrary units. (B) In situ hybridization for glycolytic regulators ldha, glut1, and pfkfb3 showing increased expression after DEX treatment. (Magnification: 17.5×.) (C) Fold changes in gene expression of fkbp5 in 72-hpf embryos injected with gr-MO and CTRL-MO compared with nontreated/noninjected control (set at 1). Real-time PCR analysis revealed that the expression of fkbp5 was significantly reduced in gr-MO–injected embryos, confirming the ability of gr-MO to impair the expression of the glucocorticoid receptor. (D, Left) Images of 72-hpf Tg(4xhre-tata:eGFP)ia21 in wild-type and GR CRISPR mutant background treated with 10 μM DEX in DMSO for 24 h or with vehicle control. (Magnification: 10×.) (Right) Quantification of GFP reporter fluorescence, showing that the HRE reporter failed to respond in the GR mutant background. Generation of this GR mutant is described in SI Text. EXPRESSION / LABELING:
PHENOTYPE:
|