
Fig. 1
- ID
- ZDB-FIG-171016-30
- Publication
- Vettori et al., 2017 - Glucocorticoids promote Von Hippel Lindau degradation and Hif-1α stabilization
- Other Figures
- All Figure Page
- Back to All Figure Page
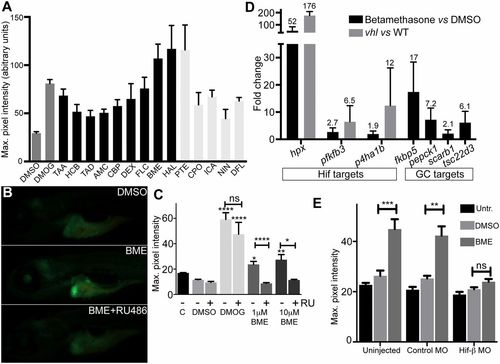
Identification of glucocorticoids as HIF activators. (A) Retest of hits from the Spectrum screen for activators of the HIF response in phd3:eGFP zebrafish, where compounds showing an average GFP level of >44 are shown. Averaged maximum pixel intensity and SEM are shown for between five and nine embryos. Dark gray: controls; black: GC-like compounds; light gray: non-GC hits. AMC, amcinonide; BME, betamethasone; CBP, clobetasol propionate; CPO, ciclopirox olamine; DEX, dexamethasone; DFL, 8,2-dimethoxyflavone; FLC, fluocinonide; HAL, halcinonide; HCB, hydrocortisone butyrate; ICA, icariin; NIN, 7-nitroindazole; PTE, ptaeroxylin; TAA, triamcinolone acetonide; TAD, triamcinolone diacetate. (B) BME activates phd3:eGFP in an RU-486–dependent manner; representative images show the activation specific to the liver in BME-treated embryos and reduced GFP expression following BME+RU-486 cotreatment. (Magnification: 16×.) (C) Quantitation of phd3:eGFP response. DMSO was added to 1% vol/vol in all experiments except Control (C), DMOG to 60 μM, and RU-486 to 5 μM as indicated (n ≥ 9). (D) BME induction of hypoxia-regulated genes and GC target genes, where values above bars indicate average fold change (FC) and triplicate samples of 20 embryos were used. For the hypoxia-induced genes, FC induction in vhl mutants vs. wild type is given as a comparison, where FC is calculated using ΔΔCT ± SEM. (E) HIF1β-MO abrogates BME activation of phd3:eGFP. Maximum pixel intensity in embryos as grouped by injection showing mean ± SEM (n = 14). Significance was calculated using Kruskal–Wallis one-way ANOVA followed by Dunn’s multiple comparison test for treatments against DMSO (*P < 0.05; **P < 0.01; ***P < 0.001; ****P < 0.0001). |