- Title
-
Mechanosensory neurons control the timing of spinal microcircuit selection during locomotion
- Authors
- Wyart, C., Knafo, S., Fidelin, K., Prendergast, A., Tseng, P.B., Parrin, A., Dickey, C.W., Böhm, U.L., Nunes FIgueiredo, S., Thouvenin, O., Pascal-Moussellard, H.
- Source
- Full text @ Elife
|
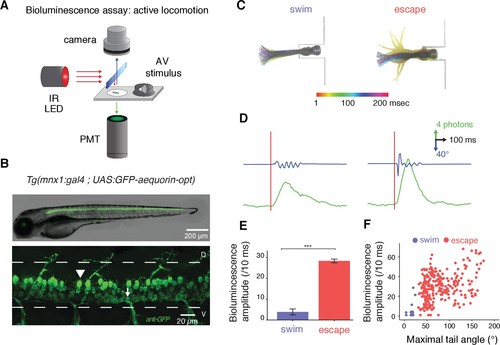
Amplitude of bioluminescence signals in spinal motor neurons correlates with the type of locomotor maneuver during active swimming. (A) Bioluminescence signals emitted from spinal motor neurons in Tg(mnx1:gal4;UAS:GFP-aequorin-opt) zebrafish larvae at 4 dpf were recorded using a photomultiplier tube under infrared illumination during active behaviors elicited by an acoustic stimulus. (B) Live fluorescent image (upper panel) and immunohistochemistry for GFP (lower panel) in a 4 dpf Tg(mnx1:gal4;UAS:GFP-aequorin-opt) zebrafish larva showing selective expression in spinal motor neurons (arrowhead: dorsal primary, arrow: ventral secondary motor neurons), and strictly no expression in muscle fibers (n = 5). (C) Motor behaviors elicited by acoustic stimuli. Superimposed traces illustrate the amplitude of tail contractions over time, for each behavior. Traces are color-coded according to the delay from stimulus onset. Automated categorization classified maneuvers into escapes (n = 245/283) or swims (n = 21/283) (n = 10 larvae and 300 trials). (D) Example traces of typical bioluminescence signals and kinematic parameters observed for each category. (E) Mean bioluminescence amplitude was higher for escapes (28.4 ± 0.9 photons/10 ms; normalized amplitude per larva = 0.41 + /- 0.18) than swims (3.9 ± 1.4 photons/10 ms, p<0.001; normalized amplitude = 0.06 + /- 0.02, p<0.001). (F) Correlation between bioluminescence signal amplitude and maximum tail angle amplitude (R = 0.4, p<0.001). |
|
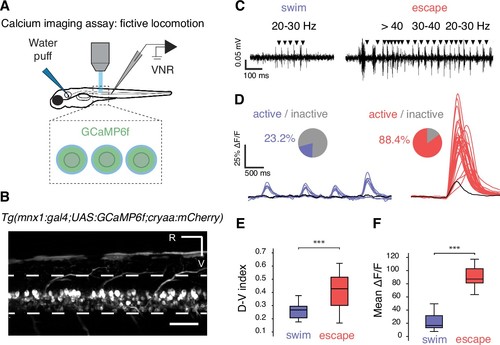
Calcium imaging in paralyzed larvae confirms a larger recruitment of spinal motor neurons for fast escapes than for slow swimming. (A) Calcium transients emitted from spinal motor neurons in Tg(mnx1:gal4;UAS:GCaMP6f,cryaa:mCherry) zebrafish larvae at 4 dpf were recorded simultaneously with ventral nerve root recordings (VNR) during fictive behaviors elicited by a water puff to the otic vesicle. (B) Expression pattern in a Tg(mnx1:gal4;UAS:GCaMP6f,cryaa:mCherry) larva at 4 dpf (R is rostral, V is ventral; scale bar is 50 µm). (C) VNR for each fictive behavior illustrates typical spontaneous fictive slow swims and induced fictive escapes: burst frequencies ranged between 20–30 Hz for slow swims (left panel) and 20–80 Hz for escapes (right panel). (D) GCaMP6f signals from individual motor neurons during spontaneous slow swimming (4 swims, left panel) and during an evoked escape response (right panel). For each recording, out-of-focus light was estimated within the spinal cord (black trace) and used as a criterion to determine the active vs inactive status of each cell. Pie charts represent the proportion of active cells in each behavior: 16/69 cells across 27 swims versus 61/69 cells across 12 escapes (n = 3 larvae). (E) Dorso-ventral (D–V) position of cells recruited during each maneuver shows dorsal motor neurons only active during escapes (the dorso-ventral axis within the spinal cord is normalized to 0 at the ventral limit and 1 the dorsal limit; mean D-V position for escapes = 0.41 + /- 0.02 versus 0.25 ± 0.01, p<0.001, n = 78 cells in n = 3 larvae). (F) Mean ΔF/F amplitude was higher during escapes compared to spontaneous swims across larvae (91.2 ± 4.7% versus 25.9 ± 3.8%, p<0.001, 12 escapes and 27 swims in n = 3 larvae). |
|
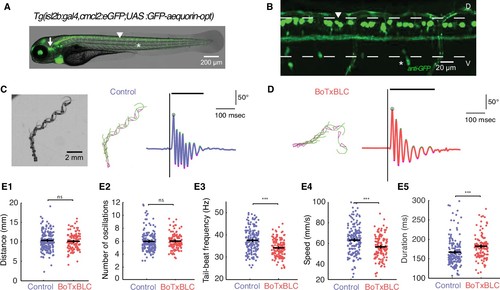
Silencing mechanosensory neurons decreases speed of locomotion. (A) In vivo fluorescence image and (B) immunohistochemistry for GFP in 4 dpf Tg(isl2b:gal4,cmlc2:eGFP;UAS:GFP-aequorin-opt) double transgenic zebrafish larva show selective expression of GFP-aequorin in mechanosensory neurons: trigeminal ganglia (arrow), Rohon-Beard spinal neurons and their ascending axons (arrowhead) and dorsal root ganglia (*), but no expression in muscle fibers (n = 4). (C–D) Superimposed images from the raw high-speed camera recording (left), the corresponding automated tracking (middle, pink triangles represent the head and green lines the tail of the fish) and tail angle over time extracted from the tracking analysis (right; stimulus is represented by the black vertical line, duration of the event is the black horizontal line) of a typical escape elicited by an acoustic stimulus in a freely-swimming control sibling larva at 6 dpf (C), and in a Tg(isl2b:gal4,cmlc2:eGFP;UAS:BoTxBLC-GFP) larva (D). (E1) Distance travelled was unchanged in BoTxBLC+ and control larvae (10.2 ± 0.2 mm versus 10.6 ± 0.2 mm, p=0.1). (E2) Number of oscillations was unchanged in BoTxBLC+ and control larvae (6.0 ± 0.2 versus n = 6.1 + /- 0.2 oscillations, p=0.6). (E3) BoTxBLC+ larvae showed a decreased tail-beat frequency (TBF, 34.2 ± 0.4 Hz versus 37.8 ± 0.3 Hz, p<0.001). (E4) BoTxBLC+ larvae showed a decreased speed of escape responses (56.9 ± 1.1 versus 64.1 ± 0.9 mm/s, p<0.001). (E5) Escape duration was increased in BoTxBLC+ larvae compared to control siblings (182.0 ± 3.0 ms versus 168.1 ± 2.4 ms, p<0.001). (For all parameters: control group: n = 176 larvae from 8 clutches, n = 561 escapes; BoTxBLC+ group: n = 128 larvae from 8 clutches, n = 329 escapes). |
|
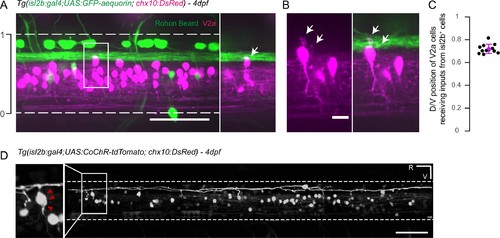
Axons of isl2b+ Rohon-Beard project onto dorsalmost chx10+ V2a interneurons in the spinal cord. (A) Z-projection stack of the spinal cord imaged from the lateral side in a 4 dpf Tg(isl2b:gal4,cmcl2:eGFP;UAS:GFP-aequorin;chx10:DsRed) triple transgenic larva. White dashed lines delineate ventral and dorsal limits of the spinal cord; these limits define the dorso-ventral (D/V) axis from 0 to 1. The axon bundle from isl2b+ Dorsal Root Ganglia (DRG) and Rohon-Beard (RB) neurons contact the soma of dorsal chx10+ V2a interneurons. The white square is enlarged in the right panel to stress the anatomical connections (arrow). (B) Dendrites of dorsal V2a interneurons are targeted by axonal processes from isl2b+ sensory neurons (arrows). (C) D/V positions of V2a neurons receiving putative inputs from isl2b+ cells (mean D/V position = 0.72 ± 0.04. N = 12 cells in n = 4 larvae). (D) Profile of expression of 4 dpf Tg(isl2b:gal4,cmcl2:eGFP;chx10:DsRed) injected with the Tg(UAS:CoChR-tdTomato) construct reveals projections from single Rohon Beard cells onto chx10+ dorsal V2a interneurons. Scale bars in (A) and (D) are 50 µm and is 10 µm in (B). For each panel rostral side (R) is on the left and ventral side (V) is at the bottom. |


