
- Title
-
Regulation of mitochondria-dynactin interaction and mitochondrial retrograde transport in axons
- Authors
- Drerup, C.M., Herbert, A.L., Monk, K.R., Nechiporuk, A.V.
- Source
- Full text @ Elife
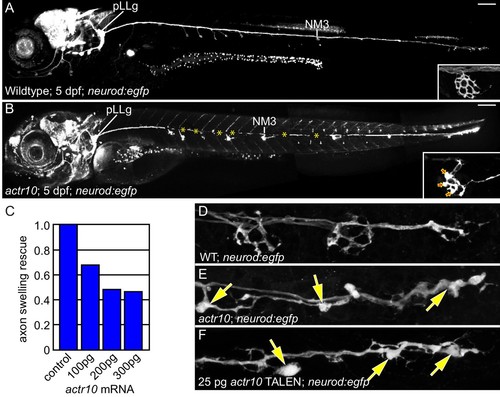
actr10 mutants have swollen axon terminals. (A) Wild-type larva (pigment free) at 4 dpf carrying the neurod:egfp BAC transgene. By 4 dpf, pLL axons are fully extended and functional synapses have formed with hair cells of primary neuromasts. (B) actr10 mutant axons fully extend but terminals display large swellings. Posterior lateral line ganglion (pLLg) and innervation of the third neuromast (NM3) are indicated. Insets in (A) and (B) show magnified NM3 axon terminals. Arrows in inset point to swellings. Asterisks label areas of the pLL nerve obscured by pigment in the mutant. (C) The mutant axon terminal swelling phenotype can be suppressed by exogenous expression of mRFP-Actr10 in a dose-dependent manner. Proportion of mutants with axon terminal swellings is depicted. (D–F) Injection of TALENS targeting exon 1 of the actr10 genomic locus phenocopies the actr10 mutant axon terminal swelling phenotype in F0 injected larvae (arrows). Axons are labeled by the neurod:egfp BAC transgene (white). Scale bars in A,B = 100 µm. |
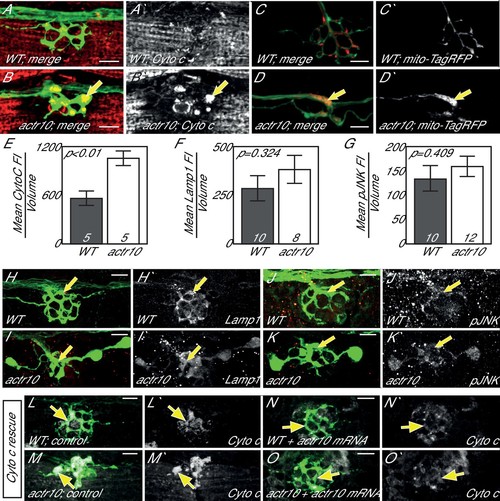
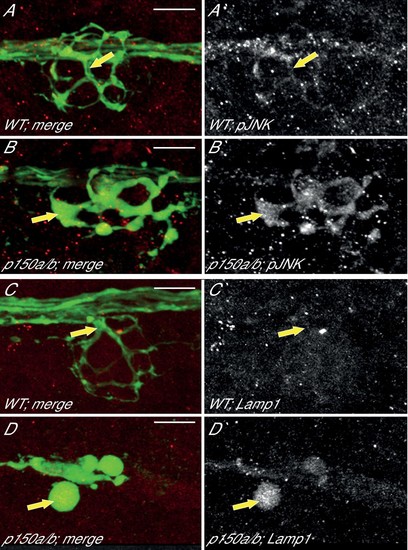
Loss of Actr10 causes mitochondrial accumulation in swollen axon terminals. (A,B) At 4 dpf, swollen axon terminals in actr10 mutants (B) have high levels of Cytochrome c immunolabeling (arrow; NM3 shown) relative to a wildtype sibling (A). (C,D) TagRFP-labeled mitochondria accumulate in actr10 mutant (arrow), but not wildtype, axon terminals at 4 dpf. (E) Mean fluorescence intensity (background subtracted) of Cytochrome C in axon terminals of A and B. (F,G) Mean fluorescence intensity (background subtracted) in axon terminals of H-K show comparable levels of Lamp1 and pJNK fluorescence intensity between wildtype and actr10 mutant terminals (ANOVA; mean ± SEM shown). (H–K) Lamp1 and pJNK immunolabeling in NM3 axon terminals (arrows). Lamp1 and pJNK are in red in (H–K) and white in H'-K'. (L–O) Mitochondrial accumulation in mutant axon terminals, assayed using Cytochrome c immunolabeling (white), can be suppressed by mRNA-mediated expression of mRFP-Actr10. Arrows point to axon terminal regions for comparison. Scale bars = 10 µm. |
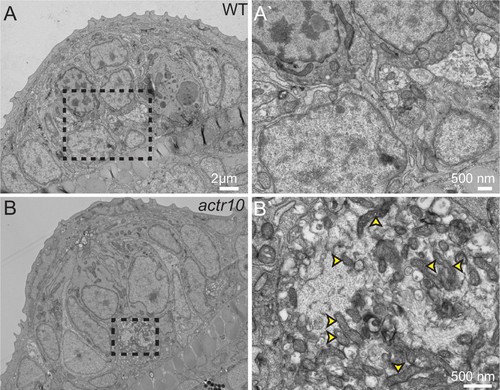
TEM analysis of axon terminal swellings reveal mitochondrial accumulation. (A) Wild-type axon terminals innervating lateral line neuromasts showed no swellings (N = 3). (B) All neuromasts assayed in actr10 mutants had mitochondrial laden axon terminal swellings (N = 4). A` and B` are higher magnification views of the areas outlined in A and B. Arrowheads in B` point to mitochondria. |
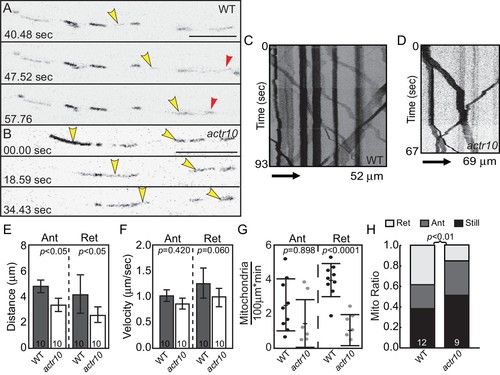
Mitochondrial retrograde transport is specifically disrupted in actr10 mutants. (A,B) Stills from Videos 1 and 2 of mitochondrial transport in single pLL axons of a wildtype (A) and actr10 mutant (B). Yellow and red arrowheads point to mitochondria moving in the anterograde and retrograde directions respectively. (C,D) Kymograph analyses of mitochondrial transport in wildtype (C) and actr10 mutants (D). (E,F) Distance and velocity of mitochondrial transport in actr10 mutants (Ant-anterograde; Ret-retrograde; ANOVA). (G) The number of mitochondria moving in the retrograde direction is significantly reduced in actr10 mutants (ANOVA; p<0001). (H) The proportion of mitochondria moving in the retrograde, but not anterograde, direction is reduced in actr10 mutants (ANOVA with post-hoc contrasts; p<0.01). Scale bars = 10 µm. Error bars represent mean ± SEM. Number of larvae assayed (biological replicates) is indicated on graphs. |
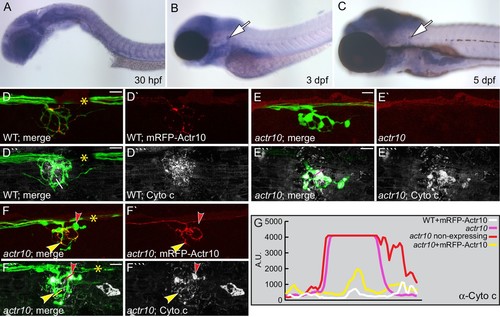
Actr10 functions cell autonomously in axons. (A–C) Expression of actr10 mRNA was assayed using in situ hybridization with DIG-labeled riboprobes and alkaline phosphatase-mediated NBT/BCIP precipitation. actr10 is ubiquitously expressed at all time points tested, with elevated expression in the nervous system at later stages (3 and 5 dpf). Arrows point to the pLL ganglion in B and C. (D) Neuronal mRFP-Actr10 expression does not alter axon morphology or mitochondrial localization in wildtype larvae at 4 dpf. Mitochondria were visualized by Cytochrome c immunolabeling in NM3 axon terminals. (E) Uninjected actr10 mutants have high levels of Cytochrome c immunolabling in NM3 axon terminals at 4 dpf. (F) mRFP-Actr10 expression in actr10 mutant neurons suppressed axon terminal swellings and mitochondrial accumulation. Yellow arrowhead points to the region of the axon terminal expressing mRFP-Actr10. Note that mRFP-Actr10 negative axon terminals (red arrowhead) display axonal swelling and high levels of Cytochrome c labeling. Lines in D'', E'' and F'' indicate regions used for line scan analysis. (G) Line scans show that mRFP-Actr10 expression rescues Cytochrome c levels in actr10 mutant axons (compare pink/red and yellow lines). Pigment cells (*) obscure some nerves. Scale bars = 10 µm. |
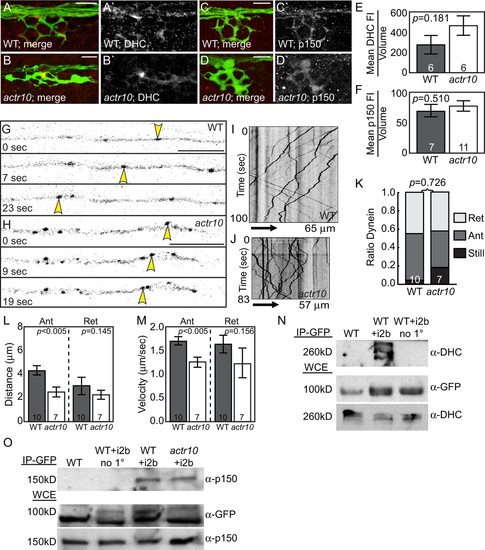
Dynein-dynactin localization and retrograde movement are intact in actr10 mutants. (A,B) Dynein heavy chain (DHC) immunolabeling demonstrates normal DHC localization in NM3 axon terminals of actr10 mutants at 4 dpf. (C,D) p150 is normally localized in NM3 axon terminals of actr10 mutants at 4 dpf. (E,F) Analyses of mean fluorescence intensity in axon terminals (background subtracted) showed comparable fluorescence intensity between mutant and wildtype siblings (ANOVA; mean ± SEM shown). (G,H) Stills from dynein time-lapse imaging sessions (Videos 3 and 4) in wildtype and actr10 mutant pLL axons at 4 dpf. Arrowheads indicate retrograde dynein movement. (I,J) Kymograph analyses of dynein transport in wildtype (I) and actr10 mutants (J). (K–M) Retrograde dynein transport parameters, including the proportion of dynein-labeled vesicles (K), distance moved by vesicles (L) and velocity of movement (M) are unaffected in actr10 mutants (ANOVA; mean ± SEM shown). A reduction of anterograde dynein-positive puncta distance and velocity was noted (ANOVA; mean ± SEM shown). (N) Dynein intermediated chain 2b fused to GFP (i2b-GFP) interacts with the core dynein complex. Immunoprecipitation of i2b-GFP from whole embryo extracts followed by DHC western (top). Whole embryo lysate controls for i2b-GFP (middle; top band not present in wildtype) and DHC (bottom). Bead only (no 1°) immunoprecipitation controls shown. (O) The core dynein complex labeled by i2b-GFP can immunoprecipitate p150 from whole larval lysates derived from wildtype and actr10 mutant larvae at 4 dpf (top). Whole larval lysate control for i2b-GFP (middle) and p150 (bottom). Bead only (no 1°) and un-injected wildtype immunoprecipitation controls shown. Scale bars = 10 µm. Number of larvae assayed is indicated on graphs. |
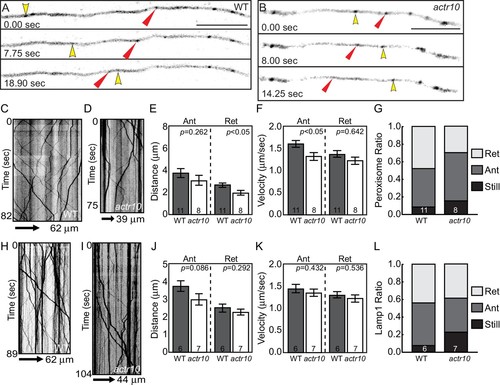
Peroxisome and Lamp1 vesicle transport in actr10 mutants at 4 dpf. (A,B) Stills from peroxisome imaging sessions at 4 dpf from Videos 5 and 6. Yellow and red arrowheads point to anterograde and retrograde peroxisome movement respectively. (C,D) Kymographs analyses of peroxisome transport in wildtype (C) and actr10 mutants (D). (E–G) Peroxisome transport parameters were similar between actr10 mutants and wildtype siblings, though a slight reduction in retrograde distance and anterograde velocity were noted (ANOVA; mean ± SEM shown). The proportion of peroxisomes moving in the retrograde direction was reduced as well, though not significantly (ANOVA; mean ± SEM shown; p=0.07). (H,I) Kymographs of Lamp1-labeled vesicle movement at 4dpf. (J–L) Lamp1 vesicles were transported similarly between wildtype and actr10 mutants. An increase in the proportion of these vesicles in mutants that were stationary during imaging was noted (p<0.01; ANOVA; mean ± SEM shown). Number of larvae assayed is indicated on graphs. Scale bars = 10 µm. PHENOTYPE:
|
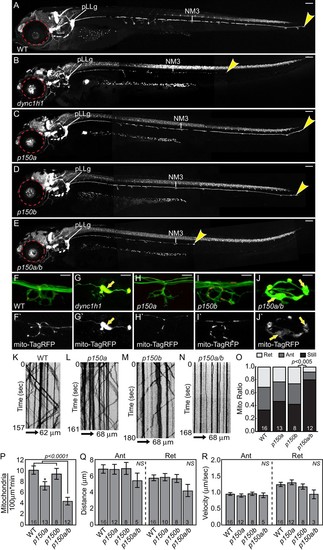
dync1h1 and p150a/b mutants fail to phenocopy actr10 mutants. (A) Wildtype larva at 4 dpf with full pLL axon extension into the tail. End of pLL nerve indicated by arrowhead. (B) Loss of DHC in dync1h1 mutants results in pLL axon degeneration, leading to a truncated pLL nerve at 4 dpf. Small eyes are also apparent (red dotted line), as has been reported previously. (C) p150a mutants have small eyes (red outline) but pLL nerves are identical to wildtype siblings. (D) p150b mutants at 4 dpf with normal pLL nerves and no change in eye diameter. (E) p150a/b double mutants have truncated, thin pLL nerves with swellings along the length of axons and in terminals and are indistinguishable from dync1h1 mutants. p150a/b mutants also show small eyes similar to dync1h1 and p150a mutants. (F,G) dync1h1 mutants display axon terminal swellings and mitochondrial accumulation compared to wildtype controls at 4 dpf. Arrows point to mitochondria rich, axonal swellings. Mitochondria are labeled by expression of mito-TagRFP (red on top F-J, white below F'-J'). (H,I) p150a and p150b single mutants have axon terminal morphology and mitochondrial localization in axon terminals similar to wildtype siblings. (J) Loss of both p150 paralogues (p150a/b; J) results in swollen axon terminals with increased mitochondrial density similar to dync1h1 mutants (G). (K–N) Kymograph analyses of mitochondrial transport in p150 mutants. (O) The proportion of mitochondria moving in both the anterograde and retrograde direction in pLL axons is significantly decreased in p150a/b double mutants (ANOVA with Tukey HSD post-hoc contrasts). (P) The number of mitochondria in pLL axons is decreased in p150a mutants compared to wildtype siblings (ANOVA with Tukey HSD post-hoc contrasts; *p<0.05). The number of mitochondria in pLL axons of p150a/b double mutants is dramatically reduced compared to wildtype siblings (ANOVA with Tukey HSD post-hoc contrasts; mean±SEM shown). (Q,R) Distance and velocity of limited residual mitochondrial movement is not significantly altered in p150a/b mutants compared to wildtype siblings (ANOVA with Tukey HSD post-hoc contrasts; mean ± SEM shown). Scale bars in A-E = 100 µm. Scale bars in F-J = 10 µm. Number of larvae assayed is indicated on graphs. EXPRESSION / LABELING:
PHENOTYPE:
|
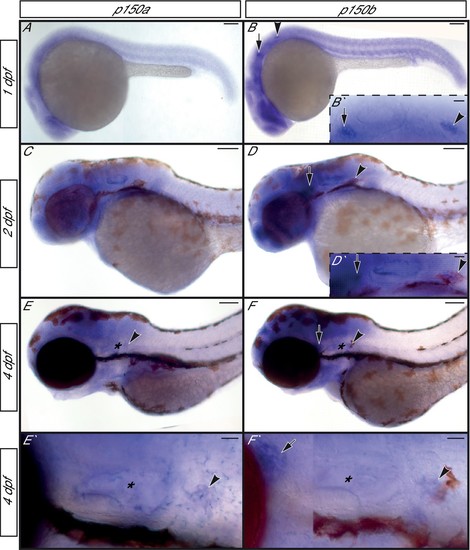
p150a and p150b expression in zebrafish embryos and larvae. (A,C,E,E`) p150a in situ hybridization shows ubiquitous expression at 1 and 2 dpf, with a slight enrichment in neurons of the pLL ganglion at 4 dpf. (B,D,F,F`) p150b is enriched in developing neurons with low level expression ubiquitously at all stages assayed. pLL and anterior lateral line ganglia are indicated by an arrowhead or arrow respectively in all. *=ear. Higher magnification views of the ear, pLL ganglia, and anterior lateral line ganglia shown in insets in B', D', E', and F'. Scale bars in A-F = 100 µm. Scale bars in B` and D`-F`=20 µm. |
pJNK and Lamp1 accumulate in p150a/b pLL axon terminals. (A,B) pJNK accumulates in axon terminals at 4 dpf in p150a/b double mutants. NM3 shown. (C,D) Lamp1 accumulates in NM4 axon terminals at 5 dpf in p150a/b double mutants. Arrows point to axon terminals in wildtype and p150a/b double mutants in all. Axons are labeled by the neurod:egfp BAC transgene (green). Lamp1 and pJNK are show in red in A-D and white in A'-D'. Scale bars = 10 µm. |
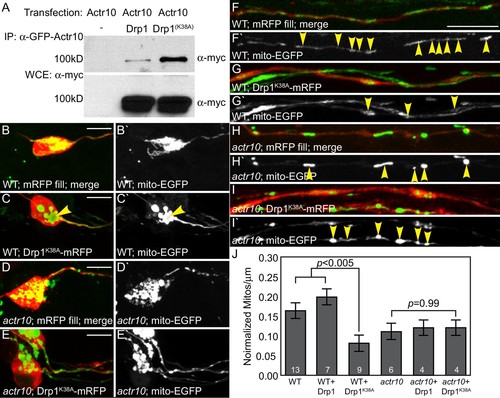
Drp1 functions with Actr10 in mitochondrial retrograde transport. (A) EGFP-Actr10 interacts with myc-Drp1 in HEK293T cells. The K38A mutation in Drp1 strengthens this interaction (n = 3 replicates). (B,C) Expression of Drp1K38A-mRFP causes mitochondrial clustering in wildtype pLL neuron cell bodies at 4 dpf compared to an mRFP only control (B). (D,E) Though mitochondrial morphology is abnormal in actr10 mutant pLL neuron cell bodies (D), expression of Drp1K38A-mRFP does not cause clustering of this organelle (E). (F–I) While expression of Drp1K38A-mRFP in wildtype larvae causes loss of mitochondria from the proximal axon compared to mRFP only controls (F,G), mitochondrial number is unaffected by Drp1K38A-mRFP expression in actr10 mutants (H,I). Arrowheads point to mitochondria in mRFP-expressing axons. Mitochondria are labeled by expression of a mitochondrial targeting sequence tagged with EGFP (5kbneurod:mito-EGFP; green in B-I, white in B'-I'). (J) Quantification of mitochondrial number normalized to mitochondrial size in the proximal axon (ANOVA with post-hoc contrasts; mean ± SEM shown). Scale bars = 10 µm. Number of larvae assayed is indicated on graphs. |