
- Title
-
Sox10 contributes to the balance of fate choice in dorsal root ganglion progenitors
- Authors
- Delfino-Machín, M., Madelaine, R., Busolin, G., Nikaido, M., Colanesi, S., Camargo-Sosa, K., Law, E.W., Toppo, S., Blader, P., Tiso, N., Kelsh, R.N.
- Source
- Full text @ PLoS One
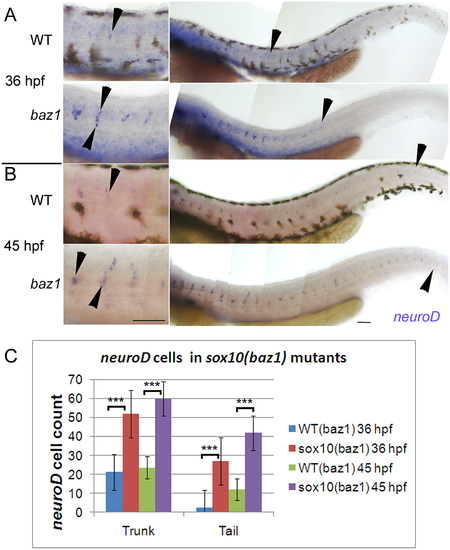
Precocious and supernumerary sensory neuron specification in sox10baz1 mutants. A,B) neurod1 expression is seen in more cells (close-ups in left panels; arrowheads indicate a subset of neurod1+ cells) and extending more posteriorly (right panels; arrowhead marks posteriormost neurod1+ DRG) in baz1 mutants compared with WT siblings at both 36 and 45 hpf. C) Counts of neurod1+ cells on one side of embryo at 36 and 45 hpf embryos (N = 11 for all conditions except 36 hpf baz1, where N = 13). baz1 mutants significantly different to WT siblings (Student’s t test; ***, p<0.0001. In this and all subsequent images, embryos are shown in lateral view with dorsal to the top and anterior to the left, unless otherwise stated. Scale bar, 100 μm. |
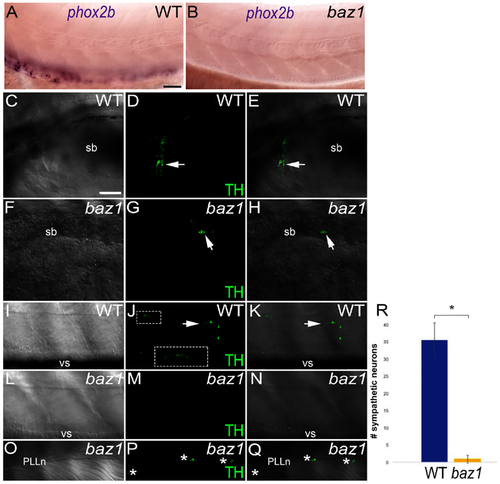
Enteric precursors are absent in baz1 mutants and supernumerary neurons in trunk and tail do not express markers of non-sensory neuronal types. A,B) phox2b expression at 72 hpf in wild-types (A) is restricted to the enteric neuron progenitors, but is absent from baz1 embryos (B). Tyrosine hydroxylase (TH) immunofluorescence reveals differentiated sympathetic neurons at 7 dpf in WT (C-E, I-K), whereas these are much reduced in baz1 mutants (F-H, L-M). White arrows indicate a subset of TH+ neurons. Inset in J represents enlargement of boxed area to show autonomic neuron chain more clearly. Occasional baz1 mutants show anti-TH immunofluorescence in neurons (*) associated with the PLLn (O-Q). DIC (C,F,I,L,O) and immunofluorescent TH images (D,G,J,M,P) are merged in panels E,H,K,N,Q respectively. sb, swim bladder; vs, ventral stripe. R) Quantitation (mean ± s.d.) of anti-TH positive sympathetic neurons in WT (N = 16) and baz1 mutants (N = 16). * indicates significant difference (two-tailed t test, p<0.001) Scale bar, 50 μm(C). |
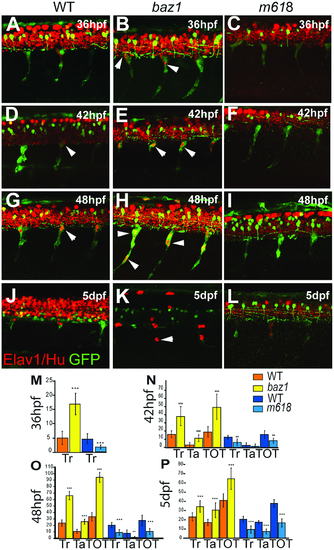
Medial pathway neural precursors undergo precocious and supernumerary differentiation into neurons in baz1 mutants. Confocal images of developing trunk DRGs of WT (A, D, G, J), baz1 (B, E, H, K) and m618 mutants (C, F, I, L) showing Elav1/Hu (red) and sox10:GFP (green) at each of 36 (A-C), 42 (D-F), 48 hpf (G-I) and 5 dpf (J-L). Arrowheads indicate subset of Elav1/Hu+ DRG sensory neurons. M-P) Counts (mean±s.d.) of trunk (Tr) and tail (Ta) and total (TOT) Elav1+ cells in DRGs of baz1 (yellow) and m618 (blue) mutants and their respective WT siblings. Significantly elevated numbers of neurons are indicated (two-tailed Student’s t test; **, p<0.01; ***, p<0.001). Note in panels J-L) that variable prominence of Elav1/Hu detection in spinal cord is an artefact of antibody penetration into CNS at this late stage. Scale bar, 50 μm. |
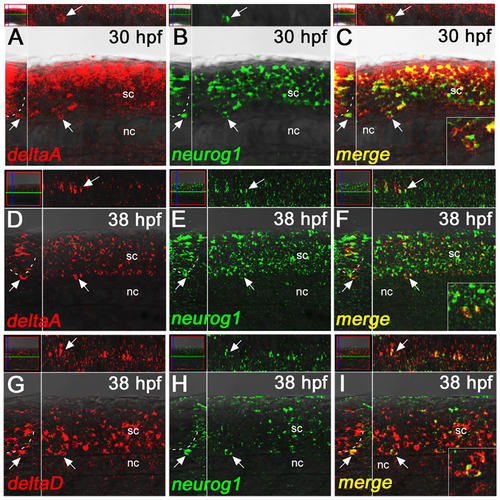
deltaA and deltaD gene expression overlaps with neurog1 in the nascent DRGs. A-C) deltaA expression (red) clearly overlaps with neurog1 (green) in the nascent DRG (arrows) at 30 hpf. D-F) At 38 hpf, deltaA expression is clearly seen in the DRGs, but weaker signals make it difficult to discern if expression is in the same cells as express neurog1 or simply in other cells of the ganglia. G-I) deltaD expression (red) clearly overlaps with neurog1 (green) in the nascent DRG (arrows) at 38 hpf. All main panels are confocal images of fluorescent dual-color in situ hybridisations in lateral view, with insets showing y-z planes (left) and x-z planes (above) for each. Insets in the bottom right of panels C, F and I show enlargements of the double-labeled cells indicated by the arrows. nc, notochord; sc, spinal cord. |
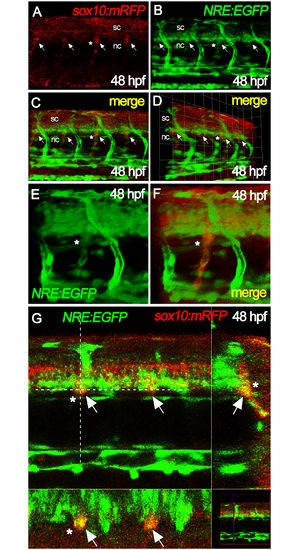
Notch signaling is active in nascent DRGs. Neural crest cells in the DRGs of 48 hpf embryos (arrows) were readily identified by expression of mRFP reporter in sox10:mRFP fish (A). These overlapped with eGFP expression from the 12xNRE:eGFP (Notch signaling) reporter (B), as shown in superimposed image (C and D). Close-ups of individual DRGs labelled with asterisk are shown in panels E and F. Panel G shows DRGs (white arrows, yellow signals) as single plane acquisitions, in lateral view (top left), transversal view (top right), dorsal view (bottom left) and mini global view (bottom right). Note that in all panels eGFP is also strongly visible in blood vessels, as expected for the Notch reporter. nc, notochord; sc, spinal cord. |
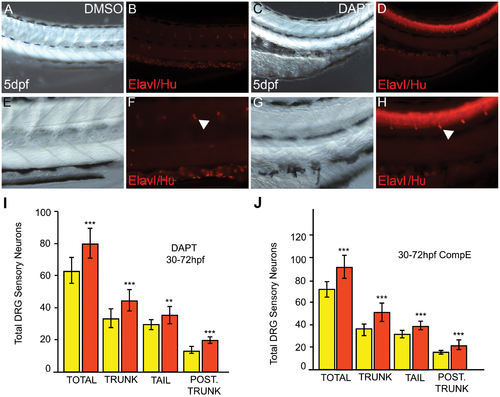
Notch inhibition phenocopies the sox10baz1 DRG phenotype. A-H) Posterior trunks of WT embryos treated with 100 μM DAPT from 30–72 hpf (C,D,G,H) and controls exposed to DMSO carrier alone (A,B,E,F). E-F show enlargements of A-D. Treated embryos show dorsally-curved body axis (C). Immunofluorescence for Elav1/Hu revealed increased numbers of DRG sensory neurons (arrowhead). I,J) Quantitation of DRG sensory neurons in 5 dpf embryos after treatment with 100 μM DAPT (I, orange) or 100 μM Compound E (J, orange) from 30–72 hpf; compared with control DMSO-treated embryos (yellow in I and J), sensory neuron numbers are significantly increased (***) when Notch signaling is inhibited. While trunk refers to the entire somitic region from posterior to the otic vesicle to the anus, tail refers to the post-anal body; posterior trunk refers to the 7 most posterior somatic segments dorsal to the yolk sac extension. N = 13 (Control, I), 13 (DAPT, I), 16 (Control DMSO, J) and 15 (Comp. E, J). Significance of elevated numbers of neurons was evaluated by two-tailed Student’s t test (**, p<0.01; ***, p<0.001). |
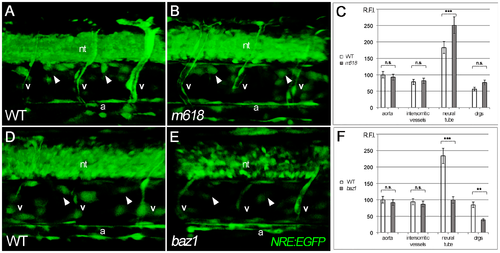
Quantification of Notch reporter differences in m618 and baz1 mutants at 48 hpf. A-F) confocal acquisitions of WT control (A,D) and mutant (B, m618; E, baz1) trunk regions, followed by Notch reporter (NRE:EGFP) fluorescence analysis (C,F). A slight increase of reporter signal is detected in the neural tube (nt) and dorsal root ganglia (drg, arrowhead) of m618 mutants (B) compared to controls (A), while a decrease of signal is detected in the same regions of baz1 mutants (compare E with D). Relative fluorescence intensity (RFI) in aorta (a) and intersomitic vessels (v) appears unmodified in all conditions. n = 6 measurements per condition. n.s. = not significant; ** = p<0.01; *** = p<0.001. |
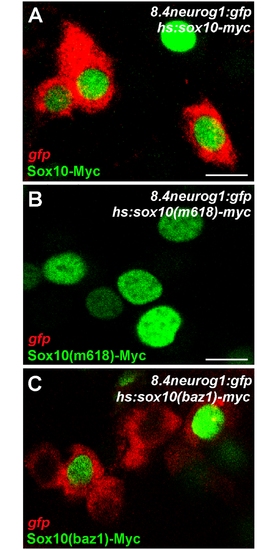
Sox10(baz1) retains transcriptional activity at neurog1. Tg(8.4neurog1:GFP) embryos were injected with expression plasmids encoding variants of Sox10. Embryos were heat-shocked at 7 hpf and fixed at 10 hpf. Expression of the Sox10 variant proteins was detected by immunofluorescent detection of their Myc tags (green) and activation of the neurog1 reporter gene is seen by In situ hybridisation against the gfp mRNA (red). Note how both WT and baz1 proteins activate Tg(8.4neurog1:GFP) reporter expression (A C), whereas m618 does not (B). Apparent non-autonomous activation of gfp after expression of Sox10(baz1) but not Sox10(WT) nor Sox10(m618) was reproducibly seen, but always restricted to cells adjacent to those expressing Sox10(baz1); the mechanism underlying this remains unclear but could be related to differential stability of the various Sox10 proteins. |
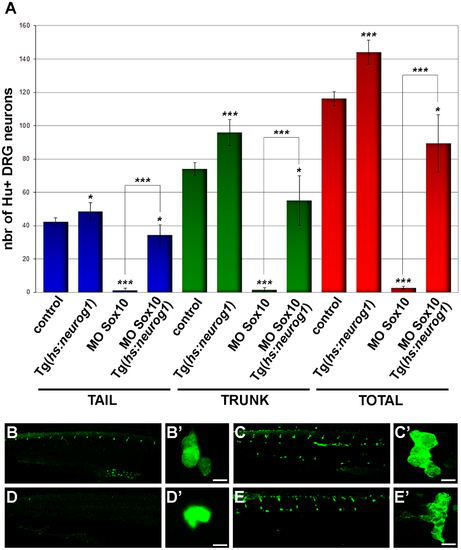
Global mis-expression of Neurog1 is sufficient to phenocopy the baz1 mutant DRG phenotype. (A) Quantification of mean (±s.d.) total numbers of Elav1/Hu+ DRG neurons in tail (blue), trunk (green) or total (red). The number of embryos analysed was 6 (WT control), 6 (hs:ngn1), 8 (MO sox10) and 7 (MO sox10, hs:ngn1). Significance of differences as determined by two-tailed Student’s t test comparisons is indicated by * (p<0.05), ** (p<0.001) and *** (p<0.0005). Control (B-C’) or sox10-morpholino injected (D-E’) embryos were left uninduced (B,B’,D,D’) or subjected to heat-shock (C,C’,E,E’) and subsequently processed for Elav1/Hu immunofluorescence at 5 dpf; embryos were heat-shocked at 28hpf for 1 hour. Panels show lateral views of trunk (B,C,D,E) and close-ups of representative DRGs (B’,C’,D’,E’). |
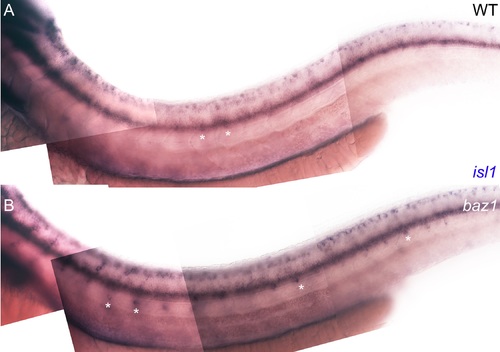
Supernumerary sensory neurons in baz1 mutants express isl1. A, B) Expression of isl1 at 48 hpf in WT (A) and baz1 (B) is seen in DRGs (*), but is especially prominent in the baz1 mutants where supernumerary cells are often more ventrally positioned and thus more prominent. |
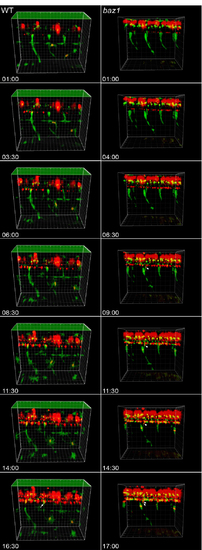
Timelapse movie frames. Extracted frames from S1 video (WT, left) and S2 video (baz1, right) of 4 segments of trunk of Tg(-4.9sox10:eGFP)ba2; Tg(neurog1(-8.4)):nRFP). Arrows indicate subset of DRG neurons (nRFP+). Time since timelapse initiated indicated in Hrs;Mins. |
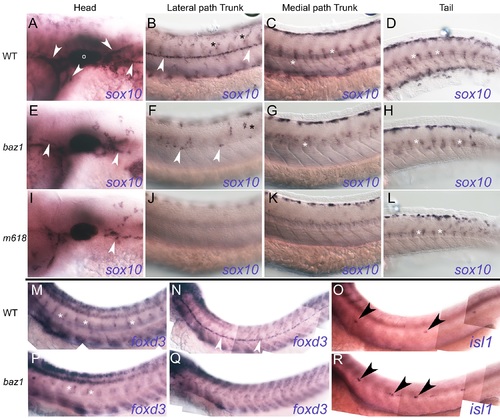
Glial specification is severely defective in baz1 mutants similar to other sox10 mutant alleles. A-L) sox10 expression at 48 hpf. Columns show sox10-expressing cells in head (A, E, I), lateral pathway of trunk (B, F, J), medial pathway of trunk (C, G, K) and tail (D, H, L) respectively of 48 hpf WT (A-D), baz1 (E-H) and m618 (I-L) mutant embryos. Glia of cranial ganglia and Schwann cell precursors on cranial and PLL nerve (white arrowheads) are prominent in WT, but highly reduced or nearly absent in baz1 and m618 mutants respectively. Cells of DRGs (white asterisk) form a prominent segmentally reiterated pattern on the medial pathway of trunk and tail of WT, but are reduced in sox10 mutants; note that in tail, where cells are developmentally younger, the DRG patterns are more similar. Xanthoblasts (black asterisk) are prominent on lateral pathway of WTs, but reduced and absent in baz1 and m618 mutants respectively. M,N,P,Q) foxd3 expression at 48 hpf. Expression in Schwann cell precursors associated with spinal nerves forms segmentally reiterated pattern readily seen in WT (M), but numbers of cells are much reduced in baz1 (P). foxd3-expressing Schwann cell precursors (white arrowhead) on PLLn are prominent in WT (N), but highly reduced in number in baz1 at 48 hpf (Q), where they are usually seen only anteriorly. O,R) Supernumerary neuromasts in baz1 mutants. Whole mount In situ hybridisation with isl1 probe in 48 hpf WT (O) and baz1 mutant (R). Note supernumerary neuromasts (black arrowheads) in baz1 mutant. Photos all from single, typical individual of each genotype, after PTU treatment. |
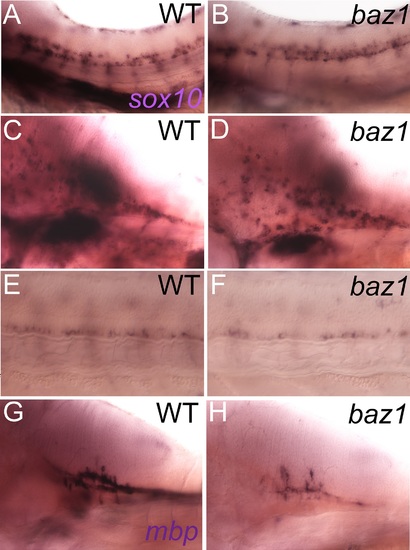
Oligodendrocyte differentiation, but not specification, is disrupted in baz1 mutants. A,B) Oligodendrocyte precursors at 48 hpf in trunk spinal cord express sox10 and are indistinguishable in number and distribution in WT (A) and baz1 mutant (B). C,D) sox10 expression in dispersing oligodendrocyte of hindbrain; note that numbers and dorsoventral distribution strongly resemble wild-type siblings. E,F) sox10 expression in oligodendrocyte progenitors in the ventralmost spinal cord are unaffected at 72 hpf; region of somites 7–11 is shown. G,H) Oligodendrocyte differentiation is abnormal as shown by strongly decreased mbp expression in hindbrain of 72 hpf embryo. |

deltaA and deltaD gene expression overlaps with neurod1 in the nascent DRGs. A-C) deltaA expression (red) is faint, but overlaps with neurod1 (green) in the nascent DRG (arrows) at 30 hpf. D-F) At 30 hpf, deltaD expression (red) overlaps with neurod1 (green) in the nascent DRG (arrows). G-I) deltaA expression (red) clearly overlaps with deltaD (green) in the nascent DRG (arrows) at 30 hpf. All main panels are confocal images of fluorescent dual-color In situ hybridisations in lateral view, with insets showing y-z planes (left) and x-z planes (above) for each. nc, notochord; sc, spinal cord. |
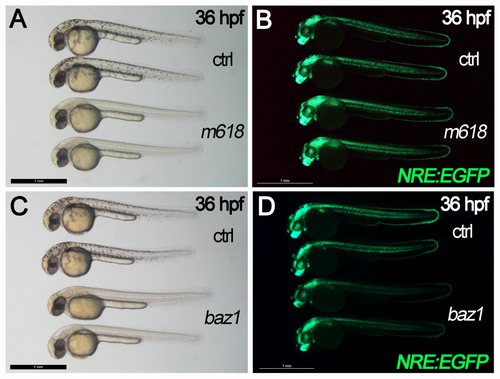
m618 and baz1 Sox10 alleles exhibit different effects on Notch signaling activation. A-D) bright field (A,C) and fluorescent (B,D) views of control (ctrl) and mutant (m618, baz1) embryos in Notch reporter (NRE:EGFP) transgenic background. m618 embryos and their controls do not show dramatic differences in Notch reporter activation, while baz1 mutants exhibit decreased fluorescent signals compared to controls. All panels display 36 hpf embryos in lateral view, anterior to the left. Scale bar: 1 mm. |
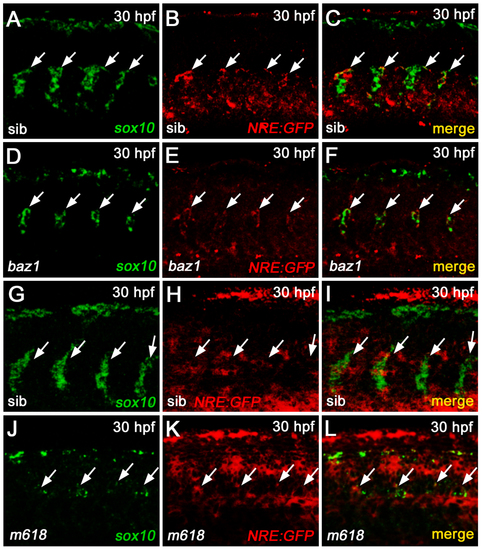
Transcriptional analysis of Notch reporter expression in sox10 mutants. A-F) fluorescent WISH analysis in baz1 and WT sib shows a decrease of sox10 and Notch reporter transcription in the DRG regions (arrows) of the mutant (D-F), compared to the control (A-C). G-L) fluorescent WISH analysis in m618 and WT sib shows a decrease of sox10 and persistency of Notch reporter transcription in the DRG regions (arrows) of the mutant (J-L), compared to the control (G-I). All panels display embryonic trunk regions at 30 hpf, in lateral view with anterior to the left. |