
- Title
-
Stathmin-like 4 is critical for the maintenance of neural progenitor cells in dorsal midbrain of zebrafish larvae
- Authors
- Lin, M.J., Lee, S.J.
- Source
- Full text @ Sci. Rep.
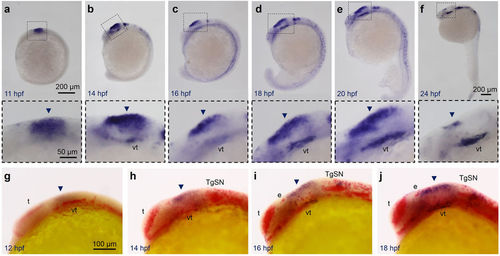
Stmn4 prohibited elavl3 expression in the dorsal midbrain during early embryogenesis. (a–f) Representative photographs of whole-mount in situ hybridization against stmn4 in zebrafish embryos at designated stages are displayed. stmn4 were highly expressed in the midbrain regions (boxed). A magnified photograph of the boxed regions is shown beneath each panel. (g–j) Representative photographs of double whole-mount in situ hybridization against stmn4 (purple) and elavl3 (red) at designated stages are presented. Arrowheads point to the dorsal midbrain. Scale bars are shown in the panels (a,g) on the right for each row unless specified in (f). Embryonic stages are shown in hours post fertilization (hpf) at the lower left corner in each panel. e: epiphysis; t: telencephalon; TgSN: trigeminal ganglion sensory neurons; vt: ventral tegmentum. EXPRESSION / LABELING:
|
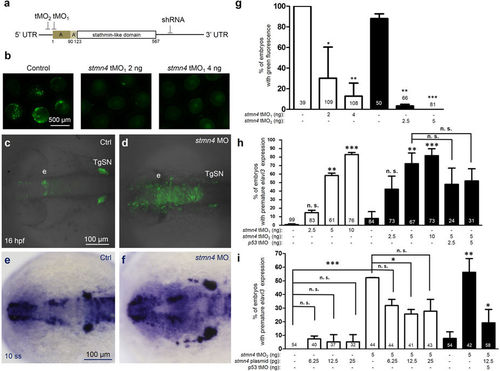
stmn4 knockdown resulted in premature expression of elavl3 in zebrafish embryos. (a) Target sites are indicated for two antisense translational blocking morpholino oligo nucleotides (tMO1 and tMO2) and one small hairpin RNA (shRNA) at the start codon, 5′ and 3′ untranslated region (UTR), respectively. (b) Embryos were injected with 200 pg of PCS2+ vector with an insertion of a fragment of stmn4 containing both tMO1 and tMO2 binding sites as indicated in (a) without (control) or with tMO1 or tMO2 (stmn4 MO) as indicated, examined and photographed at the bud stage. The percentages of embryos with green fluorescence were calculated and compared to the control groups as shown in (g). Tg(Huc:kaede) embryos were injected without (c, Ctrl) or with different amounts of stmn4 tMO1 or tMO2 (d, stmn4 MO), P53 MO and stmn4 expression vectors, cultured to 16 hpf and examined under confocal microscopy. A stack of 10 layers (2.5 μm for one layers) from the top of midbrain were combined and shown. (e–i) Wild type embryos were treated as described previously, cultured to 10-somite stage, fixed and subjected to WISH against elavl3. Representative photographs are presented (e,f). Scale bars are only shown on the left panel in a row. A premature elevation of elavl3 expression was observed in embryos injected with stmn4 MO (f) compared that of control. The percentages of embryos with elevated elavl3 expression in the dorsal midbrain were calculated and shown in (g–i). Photographs are at the same scale in each row and scale bars are only shown in the left panels. Experiments were repeated three times. Data was analyzed by one-way ANOVA and presented as mean +/−s.e.m. *P < 0.05, **P < 0.005, ***P < 0.0005. The numbers of embryos used are shown at the top or bottom of each bar. EXPRESSION / LABELING:
PHENOTYPE:
|
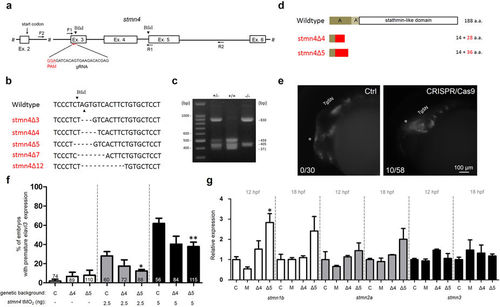
Targeted mutation of stmn4 increased stmn1b expression and caused mild precocious neuronal differentiation in dorsal midbrain. (a) A partial genomic structure of stmn4 shows the Exon 3 targeting gRNA site and sequence (PAM site in red). The two BfaI sites (arrowheads) and the sites complementary to the forward (F) and the reverse (R) primers (arrows) used for cloning for sequencing and restriction digestion assay are shown. (b) The sequence flanking the deletion site stmn4 mutants (stmn4Δ3-12) are shown. The deleted nucleotides are denoted by dashes. The cut sites of Bfa1 are indicated by arrowheads. (c) Restriction digestion by BfaI. The genomic DNAs from tail fins of wild type (+/+), heterozygous (+/−) or homozygous (−/−) stmn4Δ5 were isolated to be used as templates for PCR using the forward and reverse primers indicated in (a). The amplicons were digested and run in agarose gels and stained. A representative gel image is shown. The sizes in bp for selected DNA marker bands and digested fragments are shown. (d) Two stmn4 mutant alleles (stmn4Δ4 and stmn4Δ5) have a premature stop codons that resulted in truncated Stmn4 proteins as shown lacking all known functional domains. (e) Partial activation of precocious elavl3 expression in dorsal midbrain of F0 Tg(Huc:Kaede) embryos by stmn4 CRISPR/Cas9 compared to that of control embryos (Ctrl). (f) The % of premature elavl3 expression was determined in wildtype (C), stmn4Δ4 (Δ4) and stmn4Δ5 (Δ5) embryos-injected with indicated concentration of stmn4 tMO2. (g) Relative expression of stmn1b, stmn2a and stmn3 were measured in wildtype (C), morphant (M), stmn4Δ4 (Δ4) and stmn4Δ5 (Δ5) embryos at 12 and 18 hpf by qPCR. Data was analyzed by one-way ANOVA and presented as mean +/− s.e.m. *P < 0.05, **P < 0.005, ***P < 0.0005. EXPRESSION / LABELING:
PHENOTYPE:
|
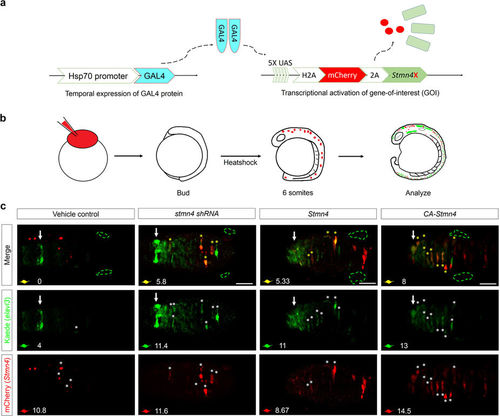
Overexpression of CA-Stmn4 or depletion of stmn4 by shRNA induced elavl3 precocious expression in dorsal midbrain. (a) Conditional gene expression system was introduced by combining Gal4-UAS system with heat shock 70 (hsp70) promoter. After heat shock, upstream activation sequence (UAS) elements will be recognized by Gal4 protein dimers (indicated by light blue) and then activate transcription of downstream genes including nuclear H2A-mCherry in red and Stmn4 intervening with a viral 2A peptide. (b) Flow chart showing the conditional expression system. We heat-shocked the Tg(HuC:Kaede) embryos injected with both plasmids described above until bud stage. After two hours of induction, embryos were analyzed until 16 hpf for elavl3 expression revealed by Kaede (green). (c) Dorsal view of midbrains between epiphysis (indicated by white arrows) and (TgSNs, circled by green dashed lines) are shown. Within one embryo, average number of precocious elavl3 (demonstrated by Kaede, green) expressing cells colocalized with (yellow) or without overexpressions of stmn4 either with mutations or its corresponding shRNAstmn4_614 (indicated by mCherry, red) in dorsal midbrain, are shown on the left-bottom corner of each panel. Scale bars are 50 μm. |
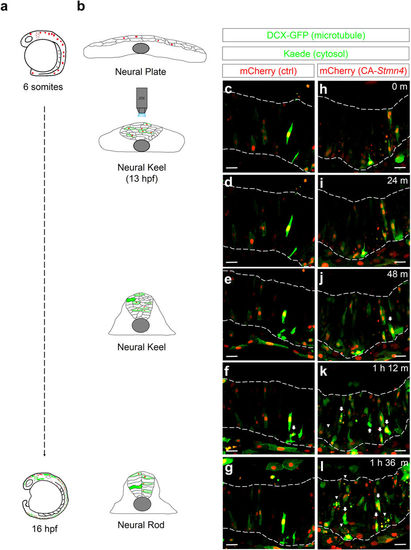
Overexpression of CA-Stmn4 induced precocious expression of elavl3 in neuronal precursor cells during neural keel stage. Time-lapse movies were conducted 6 minute per frame around the neural keel stage (13 hpf) after heat shock (6-somite stage). During neurulation (b), neural progenitor cells converge and migrate to the dorsal midline to establish neural rod (16 hpf) from a flattened neural plate (bud stage). Here, microtubules are revealed by doublecortin-GFP fusion protein (DCX-GFP, green, indicates thread-like microtubules structure depicting the cell shape). HuC:Kaede (green) expresses within cytoplasm. Compared to control embryo (c–g), more cells with elavl3 expression (arrows) and more apoptotic cells (arrowheads) appeared in embryo overexpressing CA-Stmn4 (mCherry, red) during the neural keel stage (h–l), characterized by a disorganized and thickening tissue (b). Corresponding time points are shown on the upper-right corner. Boundaries of neural tissues are disclosed by a pair of dash lines. All snapshots shown in dorsal side and anterior to the left. Scale bars equal 25 μm for all. |
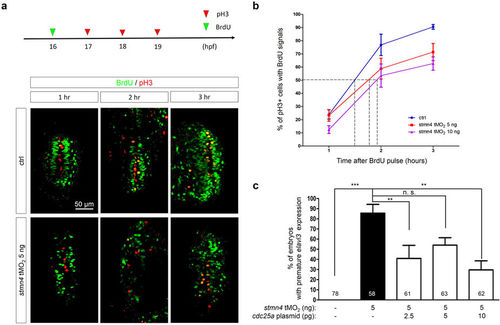
Deficiency of stmn4 prolonged the G2 phase in a Cdc25a-dependent manner. (a) 1-cell stage embryos were injected without (Ctrl) or with 5 and 10 ng stmn4 tMO2. A 15-min BrdU pulse (green arrowhead) was then given to embryos at 16 hpf. Part of embryos were fixed at an hour intervals from 17–19 hpf and subjected to double immunochemistry against α-BrdU (green) and α-pH3 (red). Fixed embryos were examined and photographed under confocal microscopy. Representative photos are presented for each treatment at designated times post the BrdU pulse. All images are shown in dorsal views with anterior to the top. Percentages of pH3+ and BrdU+ cells (yellow cells) within the pH3+ cells (yellow and red cells) were calculated as shown in (b) and analyzed by one-way ANOVA. (c) 1-cell stage Tg(Huc:Kaede) embryos were injected without or with 5 ng stmn4 tMO2 and indicated amounts of cdc25a plasmid. The percentages of embryos with premature elavl3 expression were examined and presented as described in Fig. 2. PHENOTYPE:
|
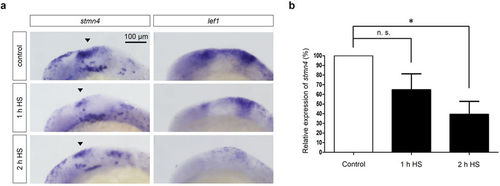
Block of Wnt signaling inhibited the expression of stmn4. Tg(hsp70l:dkk1-GFP) embryos were cultured to 10 hpf and then heat-shocked (HS) for 1 and 2 hr as indicated. Embryos were further cultured, fixed at 18 hpf and then subjected to WISH against stmn4 or lef1 (a) or qPCR analysis against stmn4 using actin as an internal control (b). Data represents mean +/− s.e.m. and analyzed by one-way ANOVA (N = 5), *P < 0.05. EXPRESSION / LABELING:
PHENOTYPE:
|
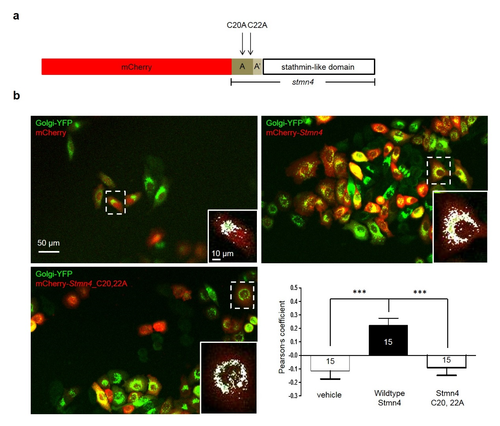
. Zebrafish Stmn4 was localized to Golgi apparatus in a cysteine-dependent manner. (a) Construct design: the mCherry with or without a C terminal full-length coding sequence of stmn4 gene, containing two N terminal domains (A and A') and a stathmin-like domain was cloned into the pCS2+ vector. Two cysteine sites, C20 and C22, on the A domain were changed to alanine that could interfere with Golgi membrane-tethering of Stmn4. (b) Hela cells were co-transfected with Golgi-YFP to reveal Golgi in green and mCherry containing pCS2+ vector without or with wildtype or Cysteine-mutated stathmin as indicated in red. Cells were imaged and photographed under confocal microscopy and the overlapping signal in yellow indicated the stathmin was located in Golgi apparatus. A higher magnification of a dashed area is shown at the lower right corner for each panel. Scale bars are shown only on the upper left panel. To analyze the localization of Stmn4 in Golgi apparatus, the overlapping yellow signals were changed to white for clarity using the ImageJ software as shown in the higher magnification graphs. The correlations between treatments for the Golgi localization of stathmin are shown by calculating their Pearson’s correlation coefficients and statistically analyzed by one-way ANOVA as resented in the lower right graph. Data represents mean + s.e.m. *P<0.05. |
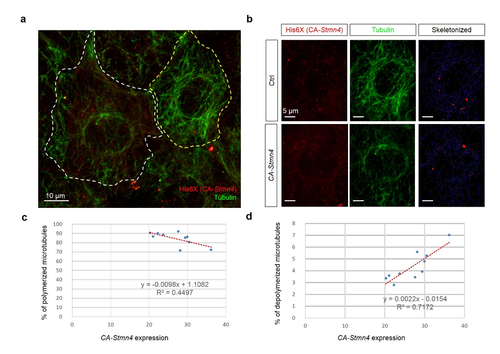
Overexpression of constitutively active stmn4 induced depolymerization of microtubules in zebrafish embryos. Zebrafish embryos were injected with plasmids containing without or with constitutively active Stmn4 (CA-Stmn4) as described in Fig. S2, cultured and fixed at the bud stage. The fixed embryos were subjected to immunohistochemistry against histidine and alpha-tubulin as described in the Materials and Methods. After staining and washing, embryos were imaged and photographed under confocal microscopy. (a) Representative image of cell overexpressed with ca-stmn4 (labeled by α-His6X, red signals) co-staining tubulin (indicated by green signals). Scale bars equal 10 μm. (b) Two separate channels one showing differential CA-Stmn4 expression level, strong (white dashed polygon, lower) and weak (yellow dashed polygon, upper), and corresponding tubulin patterns. Plugins “Skeletonized” and “AnalyzeSkeleton” of ImageJ software were utilized to transform into the right panels with labeling slabs (blue), junctions (red) and ends (green). (c,d) Percentage of polymerized or depolymerized microtubules among total tubulins were analyzed. |