- Title
-
Quantitative Analysis of Axonal Branch Dynamics in the Developing Nervous System
- Authors
- Chalmers, K., Kita, E.M., Scott, E.K., Goodhill, G.J.
- Source
- Full text @ PLoS Comput. Biol.
|
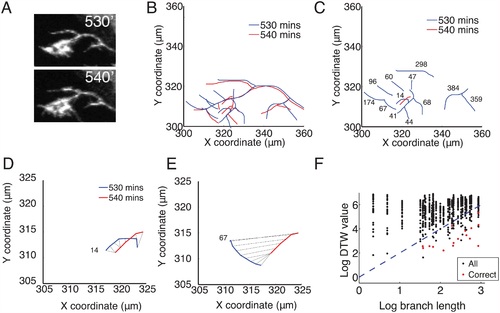
The Dynamic Time Warping (DTW) algorithm matched branches between frames based on location and length. (A): Stills froma time-lapse video at 530 and 540 minutes. Brn3C+ RGC axons were genetically sparsely labelled with mGFP. (B): Overlapped axon tracings at 530′ (blue) and 540′ (red). (C): Comparison of branches from 530′ (blue) to one branch from the 540′ frame (red). For clarity, the primary axon shafts are not shown. The number next to each blue branch is the DTW cost between it and the one red branch. Branches that are likely to be the same between two consecutive traced frames have the smallest DTW distance values. (D): DTW joins coordinates on the two branches (black lines) and assigns the lowest value (14) to the warping path, suggesting a correctly matched branch. This was confirmed by visual assessment of the tracings. (E): DTW comparison between the selected branch from 540′ and a branch further away gives a higher DTW value (67). (F): The log of the DTW distance between pairs of branches near the end of the time-lapse movie (1700′ and 1710′) versus the log of the length of the branches. The length of several branches could be similar, resulting in columns of matches that nearly overlap. The red points indicate correct matches as determined by visual inspection. The blue dotted line gives the maximum value for an acceptable branch match between consecutive frames, DTW = Length2, (the length of the branch in the first frame). This was included as a threshold for the automated matching of branches, and improved the reliability of the DTW algorithm. The branches with no corresponding red dot were correctly identified (compared to visual inspection) as having no match (deleted). |
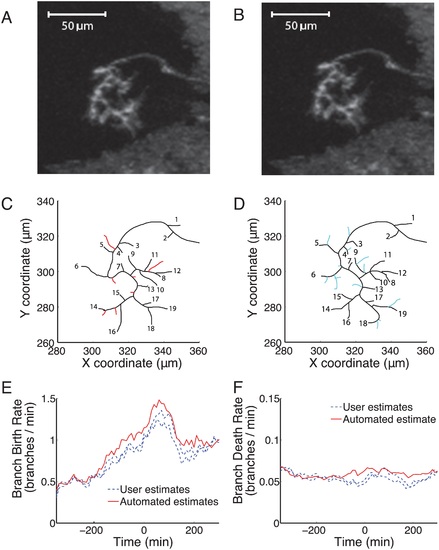
|
Branch matching using DTW identified branches that were removed, added or maintained between consecutive frames 10 minutes apart. (A) & (B): The original images of a control axon in two consecutive frames. (C): Seven branches (red) were removed completely or “died” between the two frames. (D): Thirteen new branches (cyan) were added or “born” in the ten minutes between the frames. Nineteen branches (numbered in both A and B) survived the interval (black), though they could have extended, retracted or shifted. (E): The branch birth rate for the DTW identified branches (automated, red line) was similar to that of two human users (dashed blue lines) who manually identified branches in one movie. (F): The death rate was comparable for branches either identified by DTW (automated, red line) or manually by two human users (dashed blue lines). |


