
|
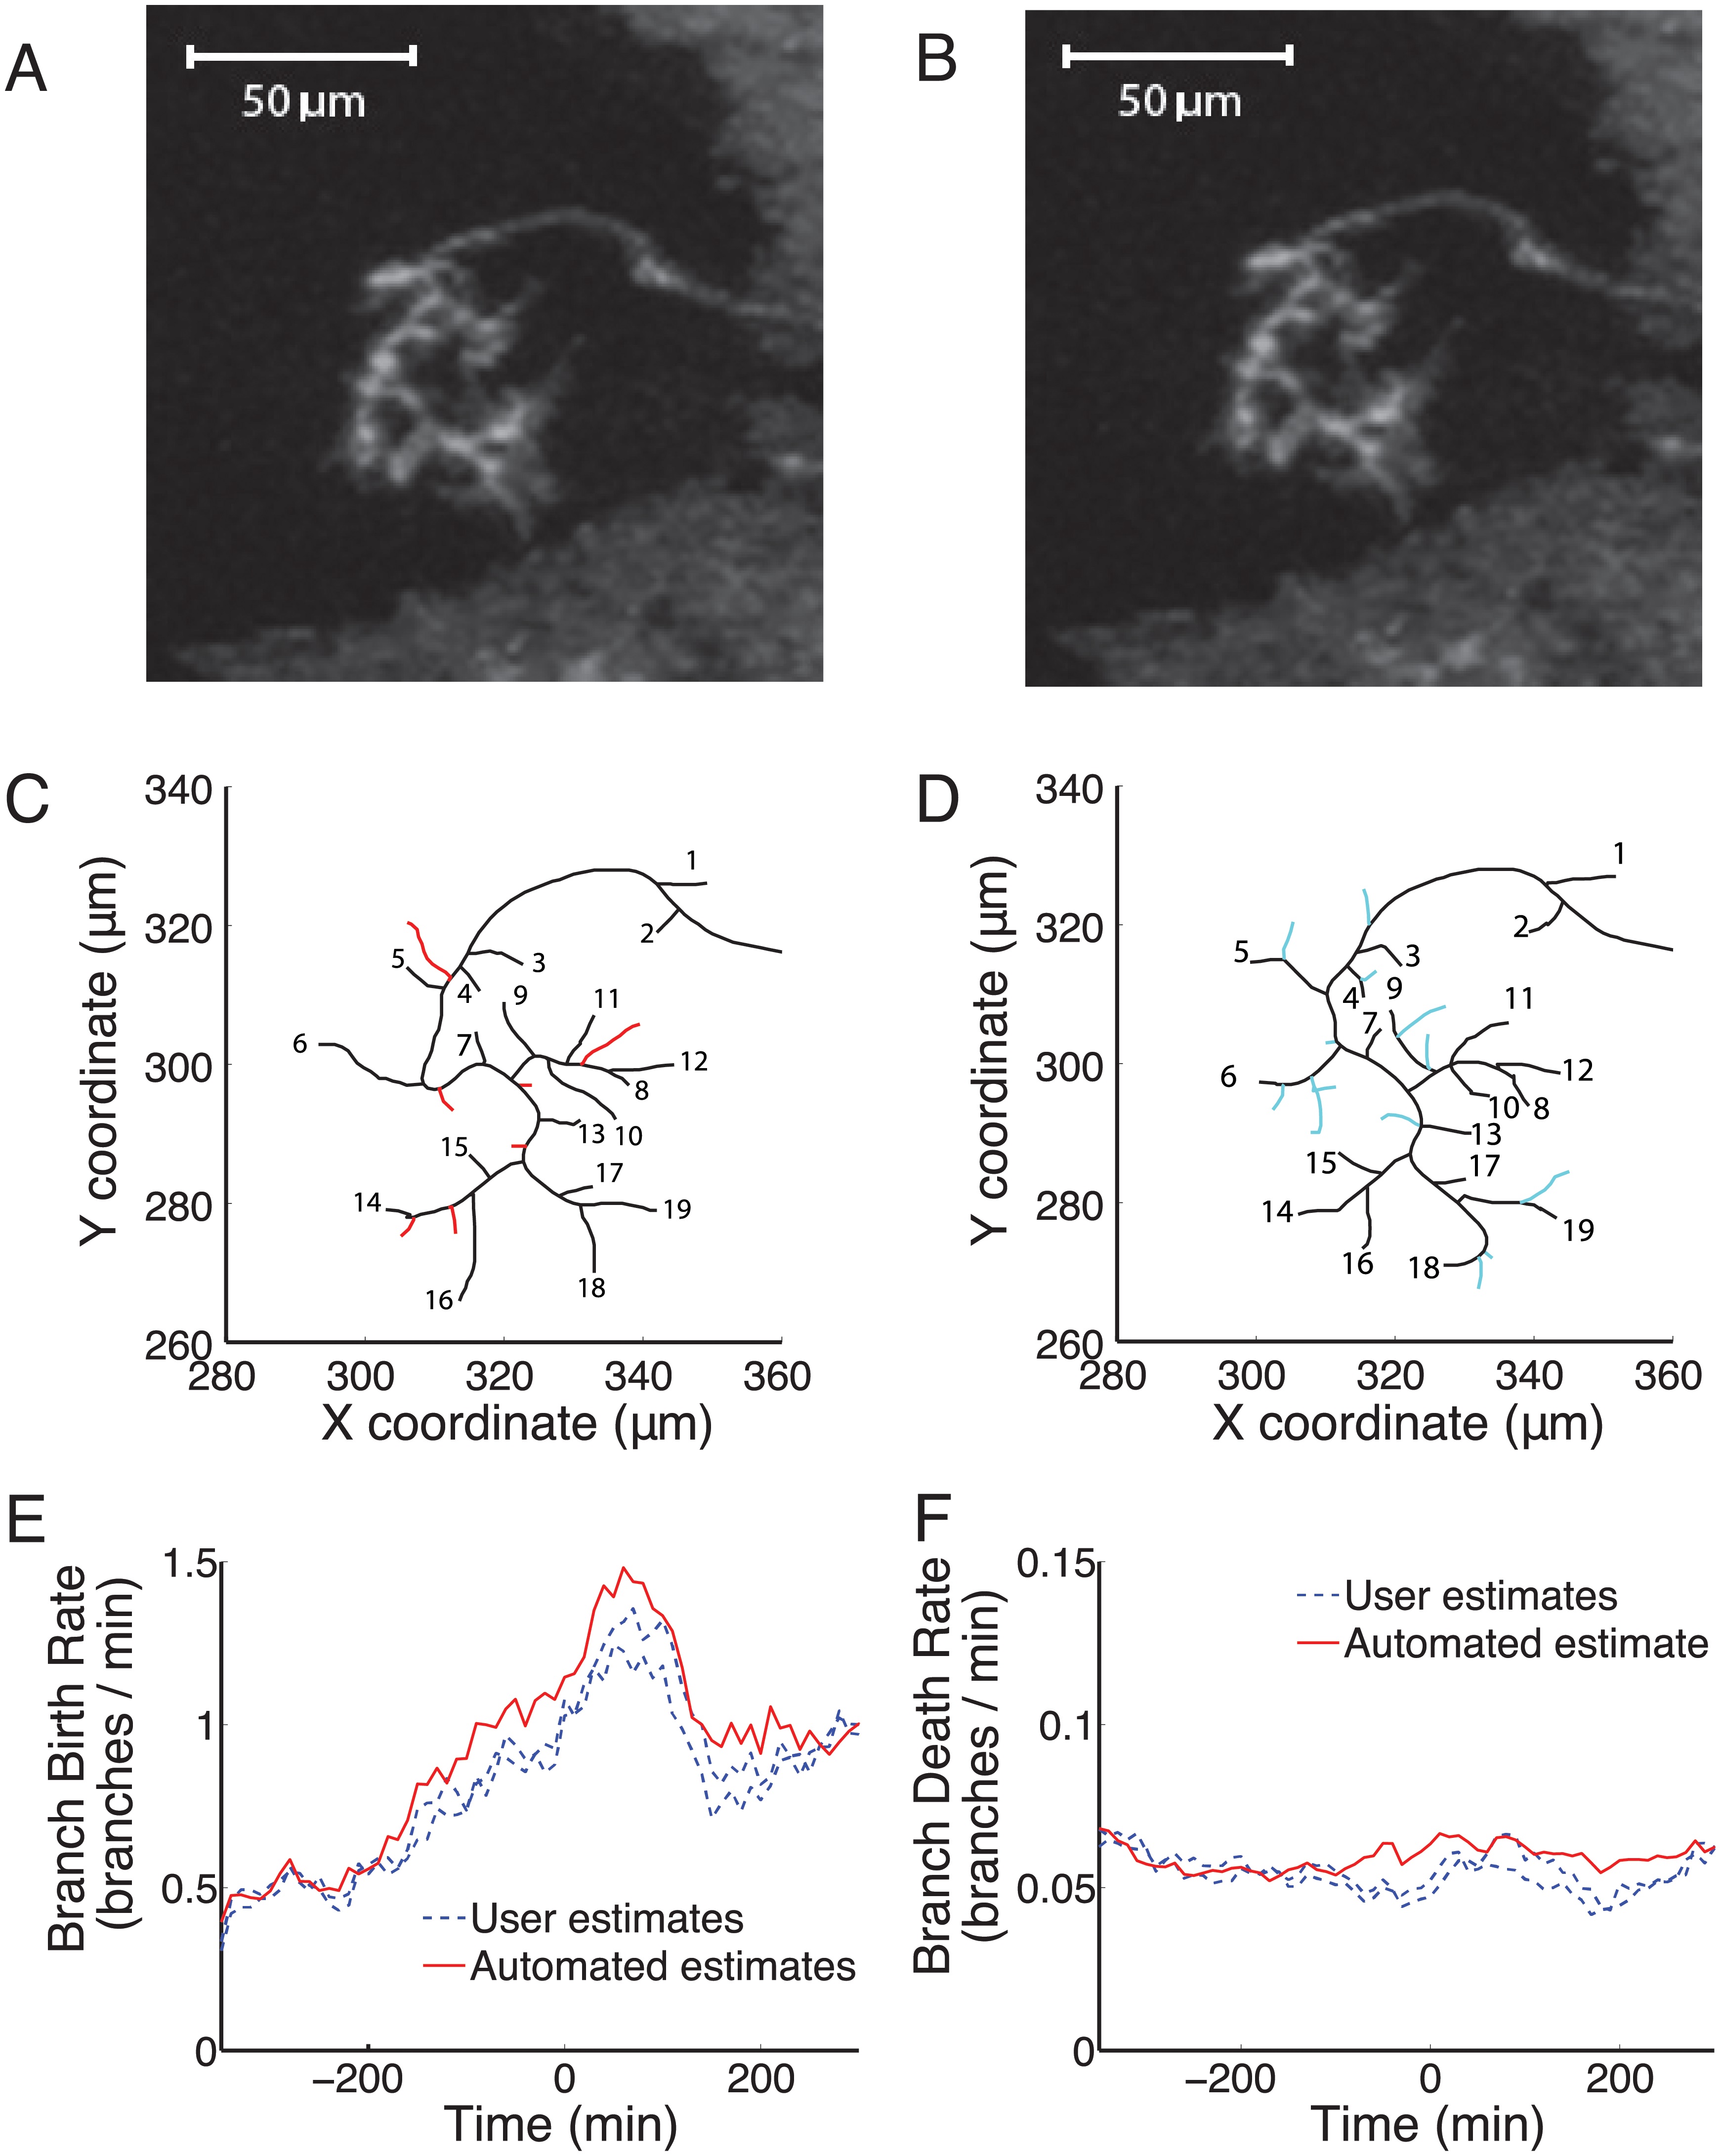
Fig. 2
Branch matching using DTW identified branches that were removed, added or maintained between consecutive frames 10 minutes apart.
(A) & (B): The original images of a control axon in two consecutive frames. (C): Seven branches (red) were removed completely or “died” between the two frames. (D): Thirteen new branches (cyan) were added or “born” in the ten minutes between the frames. Nineteen branches (numbered in both A and B) survived the interval (black), though they could have extended, retracted or shifted. (E): The branch birth rate for the DTW identified branches (automated, red line) was similar to that of two human users (dashed blue lines) who manually identified branches in one movie. (F): The death rate was comparable for branches either identified by DTW (automated, red line) or manually by two human users (dashed blue lines).