
- Title
-
Melatonin Is Required for the Circadian Regulation of Sleep
- Authors
- Gandhi, A.V., Mosser, E.A., Oikonomou, G., Prober, D.A.
- Source
- Full text @ Neuron
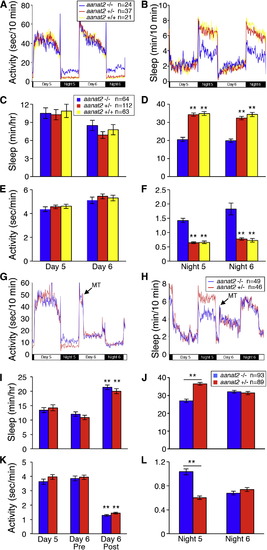
aanat2−/− Larvae Sleep Less at Night (A–F) aanat2−/− larvae sleep less (B and D) and are more active (A and F) than sibling controls at night, but not during the day (A, B, C, and E). (G–L) Arrow indicates addition of 10 μM melatonin on day 6. aanat2−/− sleep and locomotor activity phenotypes of night 5 are absent on night 6 (G, H, J, and L). During the day, exogenous melatonin decreases locomotor activity (G and K) and increases sleep (H and I) for both genotypes. Day 6 Pre and Post refer to periods before and after melatonin addition. Total sleep amount can vary for nights 5 and 6 of development, so comparisons between different genotypes should be made on the same night. Data are from one representative experiment (A, B, G, and H) or combined from two (I–L) or three (C–F) experiments. Bar graphs represent mean ± SEM. n, number of larvae. ∗∗p < 0.01 compared to aanat2−/− (C–F), each genotype Day 6 Post compared to Day 6 Pre (I and K), or the indicated comparisons (J and L) by Dunnett’s (C–F) or Tukey’s (I–L) test. See also Figure S1. |

Reduced Sleep in aanat2−/− Zebrafish Does Not Require an Entrained Circadian Rhythm (A and B) Larvae raised and tested in DD do not exhibit circadian locomotor activity or sleep rhythms. aanat2−/− larvae are more active (A, E, and F) and sleep less (B–D) than sibling controls. (G–L) aanat2−/− larvae treated with DMSO vehicle control are more active (G, K, and L) and sleep less (H–J) than aanat2+/− siblings. aanat2−/− larvae treated with 10 μM melatonin exhibit locomotor activity and sleep indistinguishable from their melatonin-treated aanat2+/− siblings (G–L). Data are from one representative experiment (A, B, G, and H), or combined from two (I–L) or three (C–F) experiments. Bar graphs represent mean ± SEM for the fifth and sixth days and nights of development. n, number of larvae. p < 0.01 compared to aanat2−/− (C–F) or aanat2−/− DMSO (I–L) by Dunnett’s test. See also Figure S3. |
|
aanat2 Is Not Required for Behavioral or Molecular Circadian Rhythms (A) Larvae raised in LD and monitored in DD maintain locomotor activity circadian rhythms. Locomotor activity data (dashed lines) were fit to damped cosine curves (solid lines) to quantify circadian amplitude (B), period length (C), and phase (D). aanat2−/− larvae have reduced amplitude due to increased locomotor activity during subjective night, but period length and phase are indistinguishable from sibling controls. Black and hatched boxes indicate subjective night and day, respectively. (E–H) Tg(per3:luc) larvae were raised in LD and luminescence recorded during 100 hr in DD. (E) Dashed and solid lines indicate luminescence data and damped cosine curve fits, respectively. (F–H) Circadian rhythm amplitude, period length, and phase are not significantly different for any genotype. Bar graphs represent mean ± SEM. a.u., arbitrary units. n, number of larvae. p < 0.01 compared to aanat2−/− by Dunnett’s test. See also Figure S4. |
|
Melatonin Is Required for Circadian Regulation of Sleep and May Promote Sleep via Adenosine Signaling (A–C) Larvae were raised in LD and tested in DD. aanat2−/− larvae, but not sibling controls, lack circadian sleep oscillations. Black and hatched boxes represent subjective night and day, respectively. There is no significant difference in amount of sleep for aanat2−/− larvae during each subjective day (B) and night (C) (p > 0.22 by Tukey’s test). (D–G) Larvae were treated with DMSO vehicle or 50 μM NECA on day 6. On night 6, vehicle-treated aanat2−/− larvae are more active (D and F) and sleep less (E and G) than vehicle-treated aanat2+/− larvae. In contrast, NECA-treated aanat2−/− larvae exhibit the same amount of activity (D and F) and sleep (E and G) as NECA-treated aanat2+/− larvae. (H–K) Larvae were treated with vehicle control or 10 μM pyrilamine on day 6. Pyrilamine decreases locomotor activity (H and J) and increases sleep (I and K) for aanat2−/− and aanat2+/− larvae to a similar extent. Bar graphs represent mean ± SEM. n, number of larvae. p < 0.01 compared to aanat2−/− (B and C), aanat2−/− DMSO (F and G), or for the indicated comparisons (J and K) by Dunnett’s (B, C, F, and G) or Tukey’s (J and K) test. Arrows indicate transient artifacts due to pipetting of compounds. See also Figure S4. |