
- Title
-
Consequences of lineage-specific gene loss on functional evolution of surviving paralogs: ALDH1A and retinoic acid signaling in vertebrate genomes
- Authors
- Cañestro, C., Catchen, J.M., Rodriguez-Mari, A., Yokoi, H., and Postlethwait, J.H.
- Source
- Full text @ PLoS Genet.
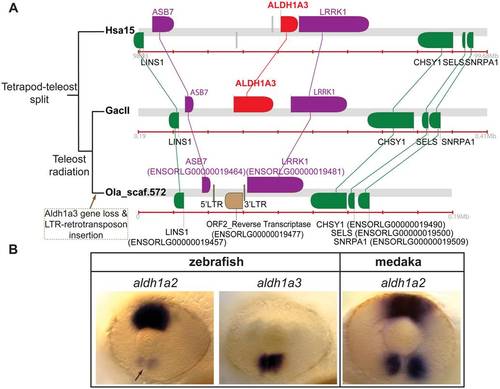
Conserved syntenies provide evidence that aldh1a3 was secondarily lost in medaka. (A) Comparative syntenic analysis of ALDH1A3 genomic neighborhoods in human, stickleback, and medaka. These results show that aldh1a3 was lost in the medaka lineage. ALDH1A3 orthologs are highlighted in red, and ALDH1A3 nearest neighbors are labeled in purple. The presence of one LTR-flanked retrotransposon including an ORF2 reverse transcriptase (in brown) in the putative locus of the lost aldh1a3 gene suggests the hypothesis that the insertion of the retrotransposon was related to the aldh1a3 loss. (B) Comparative analysis by in situ hybridization of the expression of aldh1a gene family members in the developing eye of zebrafish and medaka reveals that the medaka aldh1a2 gene recapitulates both the dorsal expression of aldh1a2 and the ventral expression of aldh1a3 in zebrafish. This result suggests that in medaka, aldh1a2 provides a ventral RA source after the loss of aldh1a3. EXPRESSION / LABELING:
|
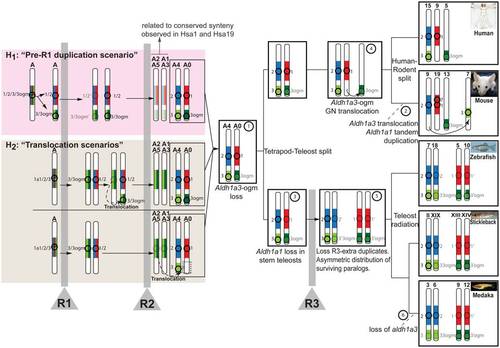
Evolutionary model reconstructs the history of the Aldh1a genomic neighborhoods from ancestral vertebrate chromosomes. Circles and numbers near chromosomes label Aldh1a paralogs, and their genomic neighborhoods are color-coded (Aldh1a1: red; Aldh1a2: blue; Aldh1a3: light green; and Aldh1a3-ogm: dark green). Duplication, preservation, losses and translocation of Aldh1 gene paralogs are inferred in ancestral vertebrate chromosomes (e.g. A0-A5 [26]). Step numbers in circles label chromosome rearrangements. Vertical gray bars signify rounds of whole genome duplication events (R1, R2 and R3). Transparent images signify lost genes. In addition to the ancestral status inferred directly from comparative genomic analysis of conserved syntenies (white background; see main text for details), the figure shows two hypotheses (pink and tan boxes) to explain the mechanisms by which the Aldh1a1/2/3/3-ogm gene precursor located in the pre-R1 chromosome “A” generated the genome neighborhoods of Aldh1a2 and Aldh1a3 in chromosome “A4”, and Aldh1a1 and Aldh1a3-ogm in “A0” inferred after R2 (step 1). Under hypothesis 1 (“pre-R1 duplication scenario” in the pink box), a segment from Nakatani et al.′s ancestral chromosome “A” including the original Aldh1a1/2/3/3-ogm gene was tandemly duplicated prior to R1 and gave rise to the Aldh1a1/2 and Aldh1a3/3-ogm genes. Considering the most parsimonious situation, after R1, one of the two homeologs preserved both Aldh1a1/2 and Aldh1a3/3-ogm, and the other homeolog lost both duplicated copies. After R2, the chromosome preserving the Aldh1a genes gave rise to “A4” and “A0”, from which today′s Aldh1a gene family members have evolved. After R2, the chromosome that did not preserve an Aldh1a gene gave rise to “A2–A5” and “A1–A3”, explaining conserved syntenies related to the Aldh1a family observed in today′s Hsa1 and Hsa19 (see Figure 2). An alternative hypothesis to explain the ancestral synteny of Aldh1a genomic neighborhoods inferred in A4 and A0 (hypothesis 2, the “translocation scenario” in the tan box) proposes a translocation event, which may have occurred either before R2 (top half of tan box) or after R2 (bottom half of tan box). In these scenarios, and in contrast to hypothesis 1, a single original gene Aldh1a1/2/3/3-ogm was present in the ancestral chromosome “A”, and after R1, aldh1a1/2 and aldh1a3/3-ogm genes originated in duplicated chromosomes. One possibility (top half in tan box) is that, before R2, a small chromosomal translocation placed Aldh1a1/2 and Aldh1a3/3-ogm on the same chromosome (dotted arrow in tan box). After R2, the chromosome “recipient” of the translocation gave rise to “A4” and “A0”, which contained all Aldh1a ancestral genes from today′s Aldh1a family members, while the chromosome “donor” gave rise to “A2–A5” and “A1–A3”, which lacked any Aldh1a gene but still preserved syntenies for Aldh1a gene neighborhoods. The possibility that the translocation carrying Aldh1a3 to the same chromosome as Aldh1a2 could have occurred after R2 cannot be discarded (dotted arrow bottom half in tan box), and would be consistent with the absence of any Aldh1a paralog in Hsa5 (white box at the bottom on chromosome A0). In this case, however, we would not expect to find paralogs of genes that are tightly linked to ALDH1A2 or ALDH1A1 on Hsa5. We found, however, genes including CCNB1, GCNT4, FAM81B in Hsa5, whose paralogs CNB2, GCNT3 and FAM81A are located near ALDH1A2 in Hsa15, and GCNT1, a third GCNT3 paralog, is close to ALDH1A1 in Hsa9. Further gene translocations, however, could explain the presence of those genes in Hsa5, and therefore a hypothetical translocation after R2 cannot be discarded. |
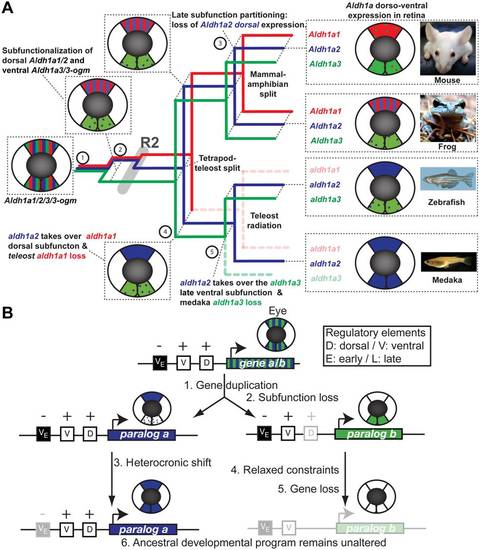
Consequences of lineage-specific gene loss on functional evolution of surviving paralogs. (A) Evolutionary model reconstructing the evolution of Aldh1a gene subfunctions in the developing retina. Mechanisms of early subfunctionalization, late subfunction partitioning, and acquisition or modification of ancestral subfunctions associated to events of gene duplication or gene loss (dotted lines) are indicated in the horizontal plane of a three-dimensional tree, in which events of vertebrate diversification are indicated in the vertical plane. A schematic retina at the stage of complete cup invagination represents dorso ventral (DV) expression domains of Aldh1a genes in different colors is indicated for present species and inferred for ancestral conditions. Bars indicate co-expression in the same dorso-ventral domains (or expression of ancestral genes), and dots refer to weak or remaining expression from earlier developmental stages. Aldh1a1: red, Aldh1a2: blue and Aldh1a3: green. Aldh1a expression data have been obtained from [58], [65], [69], [77], [79], [80], [84]–[87], [111]–[120] and this work Figure 6B). (B) Evolutionary mechanistic model to explain how the ancestral developmental program can remain unaltered after gene loss. This general model, extrapolated from our findings on the evolution of the expression of Aldh1a paralogs during eye development, is based on how heterochronic expression could facilitate the loss of a paralog, while leading to an apparent shuffling of functions between a lost paralog and a surviving paralog without the gain of new regulatory elements, but the loss of negative regulators. |