
- Title
-
Translational inhibition by deadenylation-independent mechanisms is central to microRNA-mediated silencing in zebrafish
- Authors
- Mishima, Y., Fukao, A., Kishimoto, T., Sakamoto, H., Fujiwara, T., and Inoue, K.
- Source
- Full text @ Proc. Natl. Acad. Sci. USA
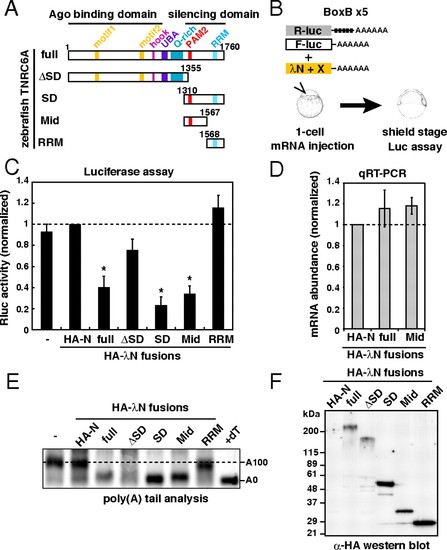
The Mid domain of TNRC6A is sufficient to induce translational repression and deadenylation. (A) Schematic structures of zebrafish TNRC6A and its deletion mutants. (B) Schematic representation of the λN tethering assay in zebrafish embryos. (C) Results of the tethering assay with TNRC6A fragments. The bar graph shows Rluc activity that was normalized to Fluc activity. The normalized Rluc activity with the HA-λN empty construct (HA-N) was set to one. The data show averages of three independent experiments. Error bars show SD. Asterisks indicate p < 0.01 compared to experiments with HA-N. (D) The qRT-PCR analysis of reporter mRNA stability. The normalized Rluc mRNA values [normalized to those of the HA-λN empty construct (HA-N)] were set to one. The data show averages of three independent experiments. Error bars show SD. (E) The poly(A) tail analysis of the Rluc-BoxB-pA reporter mRNA by RNaseH digestion and Northern blot. The lane +dT shows completely deadenylated fragments, which correspond to A0. (F) Western blotting detecting HA-tagged effecter proteins. |
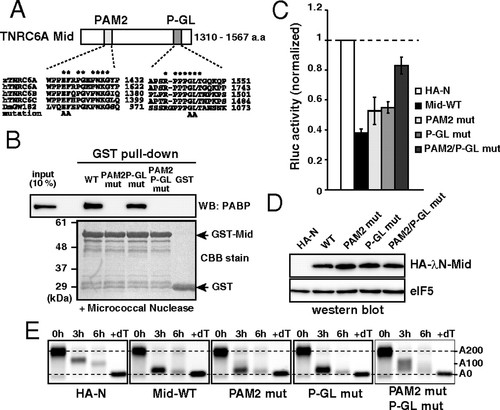
The Mid domain of TNRC6A represses translation via two motifs. (A) Schematic representation of the Mid domain of zebrafish TNRC6A. The two conserved motifs (PAM2 and P-GL) are shown. Sequence alignments of each motif comparing zebrafish TNRC6A, human TNRC6 proteins, and fly GW182 are shown. Conserved residues are marked with asterisks. Alanine substitutions introduced in the current study are shown on the bottom. (B) GST-pulldown assay detecting interaction between the GST-Mid domain and zebrafish PABP. A total of 10% of embryonic lysate was loaded as an input. PABP was detected using Western blotting (Upper). GST fusion proteins were visualized using CBB stain (Lower). (C) The results of the tethering assay with TNRC6A Mid domain mutants. The data were collected and are shown as described in Fig. 1C. (D) Western blot detecting HA-λN-tagged Mid domain proteins. The membrane was probed with anti-eIF5 antibody as a control. (E) The poly(A) tail analysis of the injected Rluc-BoxB-pA reporter mRNA using RNaseH digestion and northern blot at 0, 3 and 6 hours. The lane +dT shows a completely deadenylated fragment (A0). |
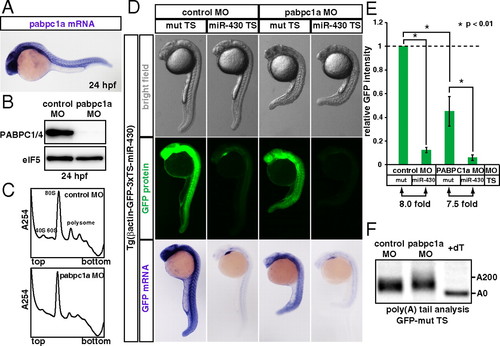
miR-430 represses its target mRNA in the absence of PABP during zebrafish embryogenesis. (A) In situ hybridization detecting pabpc1a mRNA in a 24 hpf zebrafish embryo (purple). (B) Western blot detecting PABP protein in 24 hpf embryos injected with control MO or pabpc1a MO. The membrane was probed with anti-eIF5 antibody as a control. (C) The polysome profiles of control MO-injected (Upper) and pabpc1 MO-injected (Lower) zebrafish embryos at 24 hpf. (D) Analysis of miRNA-mediated target mRNA repression in the presence or absence of PABP. Bright field view (Upper panels), GFP fluorescence (Middle panels; green) and GFP mRNA (Bottom panels; purple) of 24 hpf zebrafish embryos expressing the GFP transgene with three copies of the imperfect target site for the ubiquitously expressed miRNA, miR-430 (miR-430 TS) or with mutated target sites (mut TS). Control MO (left columns) or pabpc1a MO (right columns) was injected as indicated. (E) Quantification of GFP expression levels in 5D. GFP intensity of the embryos with the mut TS and the control MO was set to one. Error bars show SD. Asterisks indicate p < 0.01 compared to the experiment with the mut TS and control MO. (F) The poly(A) tail analysis of the GFP mut TS mRNA with the control MO or pabpc1a MO. The lane +dT shows a completely deadenylated fragment (A0). |
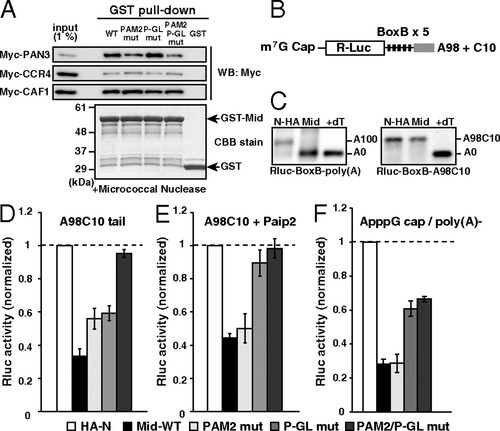
The Mid domain of TNRC6A represses translation via deadenylation-independent mechanisms. (A) The GST-pulldown assay detecting interactions between the GST-Mid domain and deadenylase components translated in rabbit reticulocyte lysate. Total of 1% of in vitro translation reaction was loaded as an input. Myc-tagged proteins were detected using Western blotting (Upper). GST fusion proteins were visualized using CBB stain (Lower). (B) Rluc reporter mRNA containing 5 copies of BoxB sites followed by the A98C10 tail. (C) The poly(A) tail analysis of the Rluc-BoxB reporter mRNAs at six hours, in the presence of control HA-λN peptide (HA-N) or the HA-λN tagged Mid domain (Mid). Left: The reporter mRNA with a normal poly(A) tail [Rluc-BoxB-poly(A)]. Right: The reporter mRNA with an A98C10 tail (Rluc-BoxB-A98C10). The lane +dT shows a completely deadenylated fragment (A0). (D) Tethering assay of the TNRC6A Mid domain with reporter mRNA containing the A98C10 tail in the presence of Myc-GFP. (E) Tethering assay of the TNRC6A Mid domain with reporter mRNA containing the A98C10 tail in the presence of Myc-Paip2. (F) Tethering assay of the TNRC6A Mid domain constructs with a reporter mRNA containing the 52 ApppG cap without a poly(A) tail. Graphs in D, E, and F show the averages of three independent experiments. Error bars show SD. |
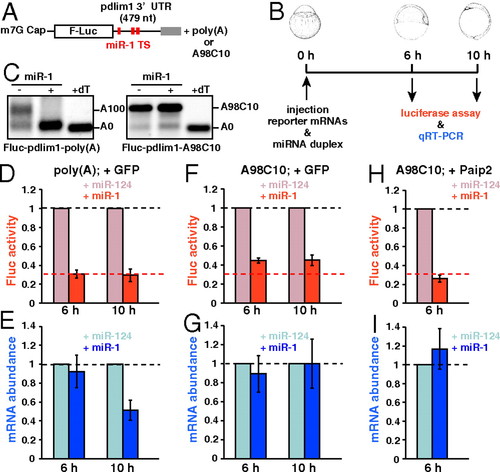
miR-1 represses target mRNA in a deadenylation- and PABP-independent manner in zebrafish embryos. (A) Fluc reporter mRNA containing zebrafish pdlim1 32UTR. Red boxes indicate the target site for miR-1. (B) Scheme of the miR-1 repression assay in zebrafish embryos. (C) The poly(A) tail analysis of the Fluc-pdlim1 32UTR reporter mRNAs at six hours in the absence (-) or presence (+) of the miR-1 duplex. The left panel shows the reporter mRNA with a normal poly(A) tail [Fluc-pdlim1-poly(A)]. The right panel shows the reporter mRNA with the A98C10 tail (Fluc-pdlim1-A98C10). (D and E) The results of the miR-1 repression assay with reporter mRNA containing a normal poly(A) tail in the presence of control Myc-GFP. (F and G) Results of the miR-1 repression assay with reporter mRNA containing the A98C10 tail in the presence of control Myc-GFP. (H and I) Results of the miR-1 repression assay with reporter mRNA containing the A98C10 tail in the presence of Myc-Paip2. D, F, and H show normalized Fluc activity. E, G, and I show normalized Fluc mRNA levels, which were measured using qRT-PCR. The values of the experiments using miR-124 were set to one at each time point. The data shows averages of three independent experiments. Error bars show SD. |
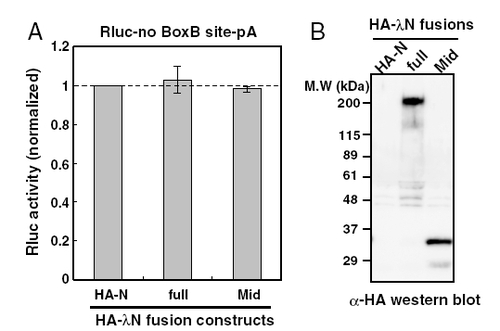
λN-HA-TNRC6 fusions do not affect reporter mRNA without the BoxB site. (A) Results of the luciferase assay with Rluc mRNA lacking the BoxB site and λN-HA fusion proteins. The bar graph shows Rluc activity [normalized to the HA-N control (lane HA-N)] was set to one. The data show the averages of three independent experiments. Error bars show the standard deviation. (B) Western blot detecting HA-tagged effecter proteins. |
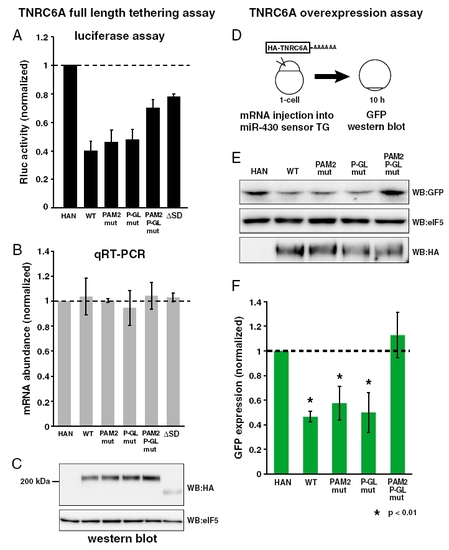
The analysis of the contributions of PAM2 and P-GL motifs in the context of full-length TNRC6A protein. (A) The results of the tethering assaywith fulllength TNRC6A mutants. The bar graph shows Rluc activity that was normalized to Fluc activity. The normalized Rluc activity with the HA-λN empty construct (HA-N) was set to one. The data show averages of three independent experiments. (B) The qRT-PCR analysis of reporter mRNA stability of Fig. S2A. The normalized Rluc mRNA values [normalized to those of the HA-λN empty construct (HA-N)] were set to one. The data show averages of three independent experiments. Error bars show SD. (C)Western blot detecting HA-λN-tagged TNRC6A proteins. The membrane was probed with anti-eIF5 antibody as a control. (D) A scheme of TNRC6A overexpression assay. mRNA encoding HA-tagged TNRC6A protein was injected into transgenic embryos that express GFP sensor for miR-430 (see also Fig. 5). GFP protein was detected by Western blotting at 10 hpf. (E) GFP protein expression at 10 hpf. (top panel). eIF5 were served as the control (middle panels). Expression of HA-TNRC6A proteins was shown in the bottom panel. (C) Quantification of GFP protein levels shown in E. The bar graph represents GFP levels normalized by eIF5. The value with HA-N was set to one. The data show averages of three independent experiments. Error bars show SD. Asterisks indicate p < 0.01 compared to the experiment with HA-N. |
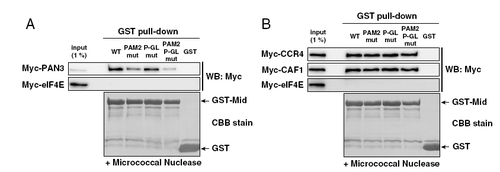
(A and B) The GST-pulldown assay detecting interactions between the GST-Mid domain and deadenylase components translated in rabbit reticulocyte lysate. Total of 1% of in vitro translation reaction was loaded as an input. Myc-tagged proteins were detected using Western blotting (Upper). GST-fusion proteins were visualized using CBB stain (Lower). |
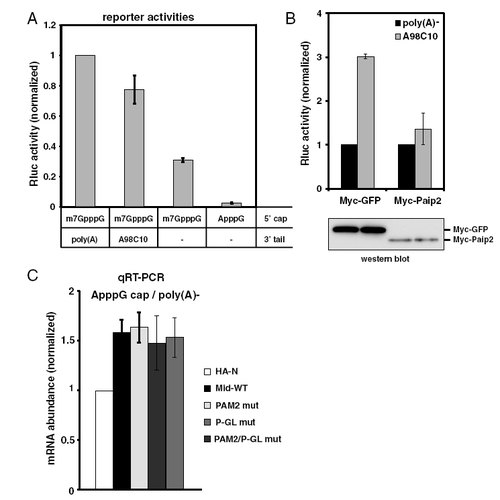
Effects of the 52cap, poly(A) tail and Paip2 on translation in zebrafish embryos. (A) The effect of the 52 cap and poly(A) tails on Rluc mRNA translation in zebrafish embryos. Rluc activity was measured at 6 hpf and normalized to the Fluc activity. The normalized Rluc activity with the m7GpppG cap and poly(A) was set to one. The data show the averages of three independent experiments. Error bars show SD. (B) The effect of Paip2 on poly(A) tail-stimulated translation. Rluc activity of poly(A)- Rluc mRNA was set to one. Western blot detecting Myc-tagged GFP or Paip2 is shown at the bottom. (C) The qRT-PCR analysis of reporter mRNA stability of Fig. 3F. The normalized Rluc mRNA values [normalized to those of the HA-λN empty construct (HA-N)] were set to one. The data show averages of three independent experiments. Error bars show SD. |
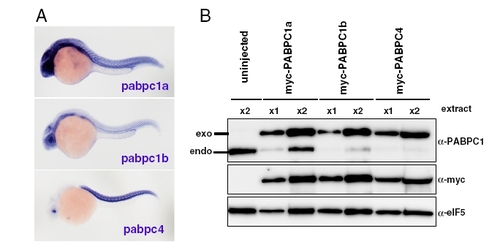
Additional information about zebrafish PABP. (A) In situ hybridization detecting pabpc1a mRNA (top), pabpc1b mRNA (middle) and pabpc4 (bottom) in 24-hpf zebrafish embryos (purple). (B) Validation of the PABP antibody used in this study. Western blotting was performed with extracts from 24-hpf embryos injected with myc-tagged pabpc1a mRNA, myc-tagged pabpc1b or myc-tagged pabpc4 mRNA. The PABP antibody detected myc-PABPC1a, myc-PABPC1b and myc-PABPC4 (Upper). The expression of myc-tagged proteins was also detected using the anti-myc antibody (Middle), and eIF5 served as a loading control (Lower). EXPRESSION / LABELING:
|
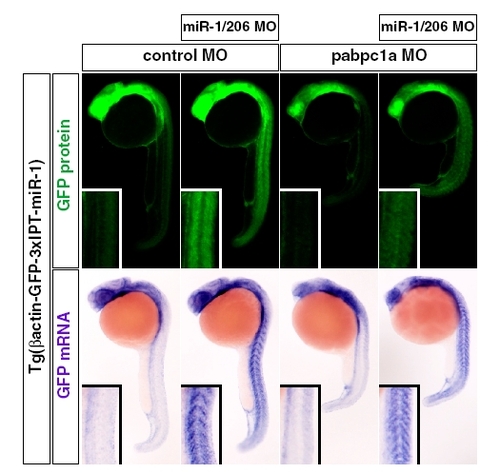
miR-1/206 regulates the gene expression pattern in the absence of PABPC1 during zebrafish embryogenesis. GFP fluorescence (Upper panels; green) and GFP mRNA (Bottom panels; purple) of 24 hpf zebrafish embryos expressing the GFP transgene with three copies of an imperfect target site for miR-1/206. The embryos were injected with either control MO or pabpc1a MO with or without miR-1/206 MO. Insets show magnified views of trunk somites. |