
|
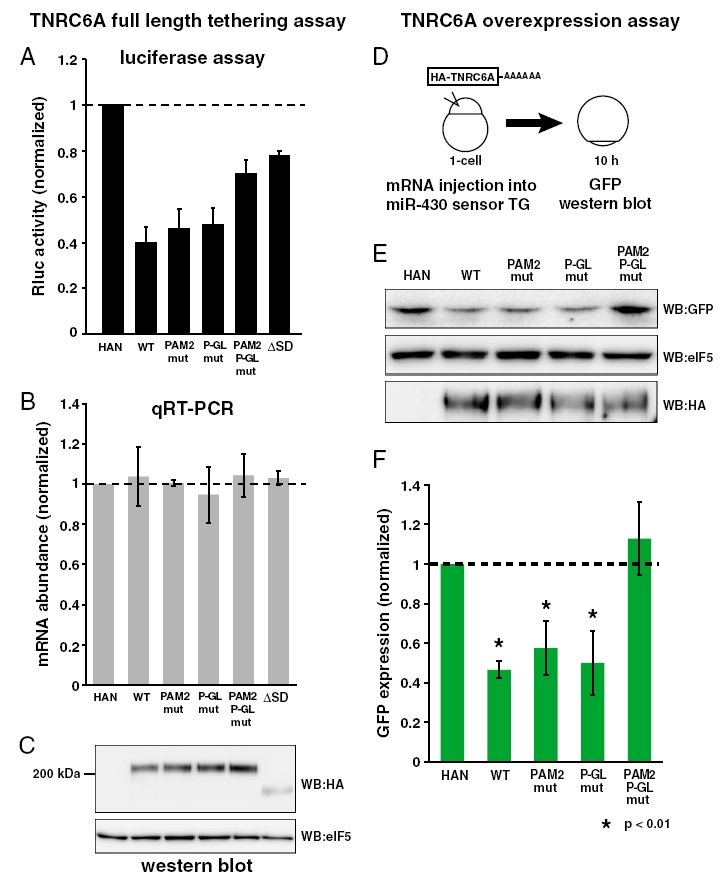
Fig. S2
The analysis of the contributions of PAM2 and P-GL motifs in the context of full-length TNRC6A protein. (A) The results of the tethering assaywith fulllength TNRC6A mutants. The bar graph shows Rluc activity that was normalized to Fluc activity. The normalized Rluc activity with the HA-λN empty construct (HA-N) was set to one. The data show averages of three independent experiments. (B) The qRT-PCR analysis of reporter mRNA stability of Fig. S2A. The normalized Rluc mRNA values [normalized to those of the HA-λN empty construct (HA-N)] were set to one. The data show averages of three independent experiments. Error bars show SD. (C)Western blot detecting HA-λN-tagged TNRC6A proteins. The membrane was probed with anti-eIF5 antibody as a control. (D) A scheme of TNRC6A overexpression assay. mRNA encoding HA-tagged TNRC6A protein was injected into transgenic embryos that express GFP sensor for miR-430 (see also Fig. 5). GFP protein was detected by Western blotting at 10 hpf. (E) GFP protein expression at 10 hpf. (top panel). eIF5 were served as the control (middle panels). Expression of HA-TNRC6A proteins was shown in the bottom panel. (C) Quantification of GFP protein levels shown in E. The bar graph represents GFP levels normalized by eIF5. The value with HA-N was set to one. The data show averages of three independent experiments. Error bars show SD. Asterisks indicate p < 0.01 compared to the experiment with HA-N.