
- Title
-
Antagonistic interactions among Plexins regulate the timing of intersegmental vessel formation
- Authors
- Lamont, R.E., Lamont, E.J., and Childs, S.J.
- Source
- Full text @ Dev. Biol.
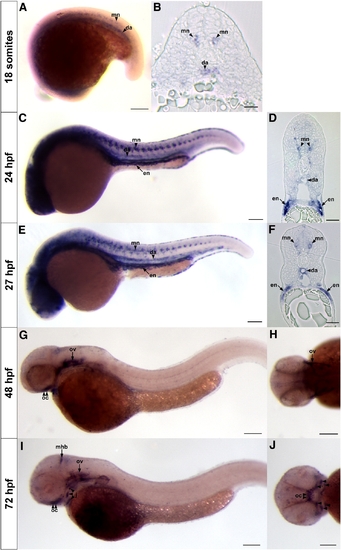
Dynamic expression of zebrafish sema3e. (A, B). At 18 somites, sema3e is expressed in one primary motoneuron per somite (mn) and the dorsal aorta (da). (C–F) At 24 and 27 hpf, continued expression is observed in a single primary motoneuron and the dorsal aorta, with expression now observed in endodermal tissue ventral to the pronephric ducts (en). (G, H) By 48 hpf, only neural expression of sema3e is observed. Signal is seen in the otic vesicle (ov) and optic chiasm (oc); persisting through 72 hpf (I, J) where expression is also observed at the midbrain–hindbrain boundary (mhb) and in developing jaw structures (j). (A, C, E, G–J) are wholemount images while (B, D, F) are transverse sections. (A, C, E, G, I) are lateral views, (H) is dorsal view, (J) is ventral view. Scale bar in A is 325 μm, B is 10 μm, C, E, G–J is 400 μm, and D, F is 30 μm. EXPRESSION / LABELING:
|
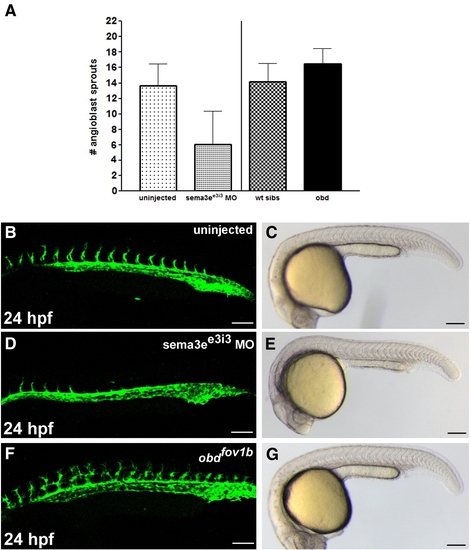
Intersegmental sprouting is delayed in sema3ee3i3 morphants and is precocious in obd mutants. (A) Graphical representation of the mean number and standard deviation of angioblast sprouts observed in sema3ee3i3 morphants and obdfov1b mutants as compared to control embryos. Confocal (B, D, F) and corresponding white light images (C, E, G) of uninjected (B, C), sema3ee3i3 morphants (D, E), and obdfov1b mutants (F, G) at 24 hpf on a Tg(kdr:GFP)la116 genetic background. Scale bar in B, D, F is 100 μm and C, E, G is 500 μm. |

Angioblast sprouting is delayed in plxnB2i10e11 and plxnB2i10e11/sema3eATG morphants. (A–B) PlxnB2 expression analysis by in situ hybridization shows semi-ubiquitous expression with ventral enrichment in the region surrounding the axial vessels in wholemount (A) and cross section views (B). The dashed line in A indicates the level of the section in B. (C–D) White light images of control (C) and plxnB2i10e11 morphant (D) at 24 hpf. (E–H) Confocal images of uninjected (E), plxnB2i10e11 morphant (F), sema3eATG morphant (G), and plxnB2i10e11/sema3eATG morphant (H) at 24 hpf on a Tg(kdr:GFP)la116 genetic background. (I) Graphical representation of the mean number and standard deviation of angioblast sprouts observed in plxnB2i10e11 morphants, sema3eATG morphants, and plxnB2i10e11/sema3eATG morphants as compared to control embryos. Scale bar in A, C–H is 100 μm and 30 μm in B. |
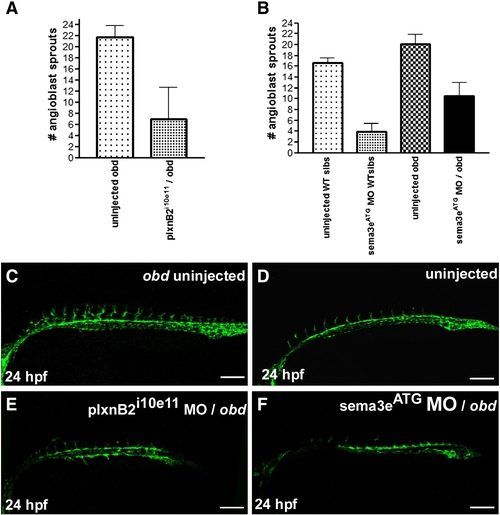
Loss of plxnD1 and sema3e/plxnB2 results in an intermediate angioblast sprouting phenotype (A) Graphical representation of the mean number and standard deviation of angioblast sprouts observed in plxnB2i10e11/obd morphants as compared to control obd mutant embryos. (B) Graphical representation of the proportion of embryos exhibiting a given number of ISVs sprouts in uninjected obd wt sibs, sema3eATG MO/obd wt sib morphants, uninjected obd mutant embryos, and sema3eATG MO/obd morphants. (C–F) Confocal images of uninjected obd mutant (C), uninjected wt sibs (D), plxnB2i10e11/obd morphants (E), and sema3eATG/obd morphants (F) at 24 hpf on a Tg(kdr:GFP)la116 genetic background. Scale bars in (C–F) are 100 μm. PHENOTYPE:
|
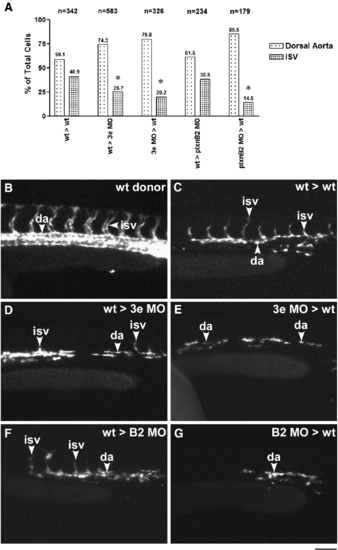
Sema3e acts both autonomously and non-autonomously in angioblasts while PlxnB2 acts autonomously. (A) Summary of the total proportion of cell types observed after transplantation given as a percentage of total cells counted. (B–E) Representative images of a Tg(kdr:GFP)la116 wild type donor embryo (B), recipient embryo from a wt > wt transplantation (C), recipient embryo from a wt > 3e MO transplantation (D), recipient embryo from a 3e MO > wt transplantation (E), recipient from a wt > plxnB2 MO transplantation (F), and recipient from a plxnB2 MO > wt transplantation (G). Arrows indicate cells classified as dorsal aorta (da), ISV cells (ISV). * denotes a probability of difference from wild type by Chi-square test of < 0.002. Scale bar is 100 μm. |
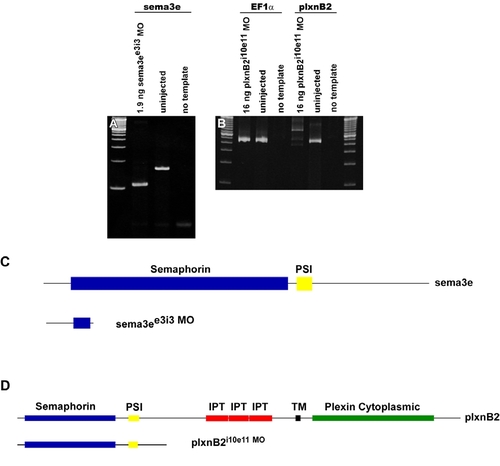
RT-PCR of sema3ee3i3 and plxnB2i10e11 morphants. |
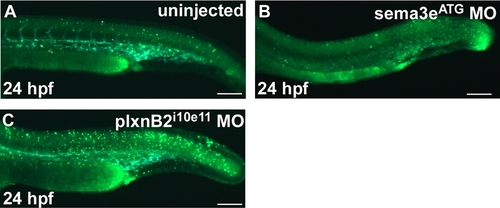
Assessment of non-specific cell death in sema3ee3i3 and plxnB2i10e11 morphant by acridine orange staining. |
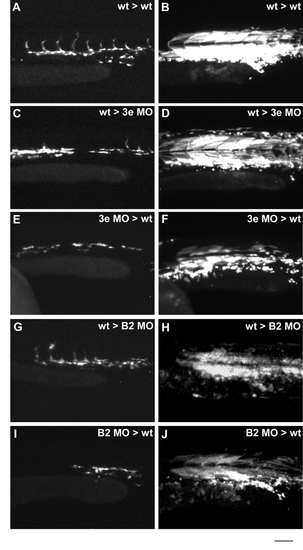
Rhodamine dextran images of representative transplanted embryos from Figure 5. |
Reprinted from Developmental Biology, 331(2), Lamont, R.E., Lamont, E.J., and Childs, S.J., Antagonistic interactions among Plexins regulate the timing of intersegmental vessel formation, 199-209, Copyright (2009) with permission from Elsevier. Full text @ Dev. Biol.