
- Title
-
Formation of the zebrafish midbrain-hindbrain boundary constriction requires laminin-dependent basal constriction
- Authors
- Gutzman, J.H., Graeden, E.G., Lowery, L.A., Holley, H.S., and Sive, H.
- Source
- Full text @ Mech. Dev.
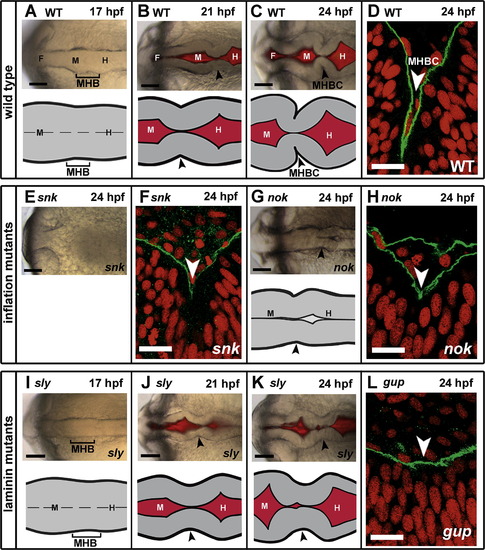
Zebrafish MHB morphogenesis occurs between 17 and 24 hpf, and requires laminin but not ventricle inflation. (A–C) Brightfield and fluorescent images and schematics of wild type (WT) MHBC formation. (D) WT embryo at 24 hpf was stained with Laminin 1 antibody (green); nuclei were stained with propidium iodide (red). Laminin lines the basal surface of the neuroepithelium. (E) Brightfield image of snk, a ventricle inflation mutant, at 24 hpf. (F) snk embryo at 24 hpf stained as in (D). (G) Brightfield image and schematic of nok, a ventricle inflation mutant, at 24 hpf. (H) nok embryo at 24 hpf stained as in as (D). (I–K) Brightfield and fluorescent images and schematics of MHBC formation in the laminin mutant, sly. (L) gup embryo at 24 hpf stained as in (D). Arrowheads indicate MHB at 21 hpf and MHBC at 24 hpf. F, forebrain; M, midbrain; H, hindbrain. Scale bars: A–C, E, G, I–K = 100 μM, D, F, H, L = 6 μM. |
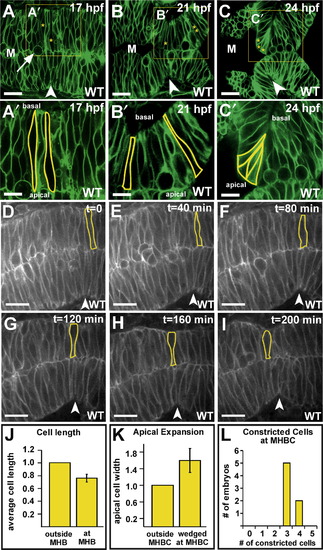
MHBC formation requires cell shortening and basal constriction. (A–C′) Live laser-scanning confocal imaging of wild type embryos injected with memGFP mRNA at the one cell stage and imaged at 17, 21, and 24 hpf. Boxed regions from (A) to (C) are enlarged for (A′–C′). Individual cells in the MHB are outlined, and a dividing cell is indicated by an arrow in (B). Asterisks in (A–C) mark cells outlined in (A′–C′). Cells with two asterisks are outside the MHB. (A′) At 17 hpf, cells at the MHB are similar in length to the cells in the surrounding tissue. (B′) At 21 hpf, cells at the MHB are shorter than the cells in the surrounding tissue. (C′) At 24 hpf, cells at the MHBC are constricted basally and expanded apically. (A–C′) Some green fluorescence is visible within outlined cells since the plane of section contains the surface of the cell membrane. (D–I) Time-course of MHB morphogenesis beginning at 17 hpf. A single cell is outlined and followed through the time course. Cells at the MHB shorten relative to those surrounding (n = 6 embryos). (J) Relative cell lengths at and outside the MHB in 21 hpf wild type embryos. Cells at the MHB were 0.76 times the length of those outside the MHB (± 0.06 s.d.) (n = 8 embryos, 3 cells at the MHB and 4 cells outside the MHB were measured per embryo). (K) Relative apical width of unwedged cells (those outside the MHBC) and basally constricted cells (at the MHBC) in wild type embryos at 24 hpf. Cells at the MHBC had 1.6 times the apical width of those outside the MHBC (± 0.29 s.d.) (n = 6 embryos, 2 cells at the MHBC and 3 cells outside the MHBC were measured per embryo). (L) Numbers of basally constricted cells at the MHBC in wild type embryos at 24 hpf (n = 9 embryos). Arrowheads indicate the MHBC. M, midbrain. Scale bars: A–C = 20 μM, A′–C′ = 9 μM, D–I = 30 μM. |
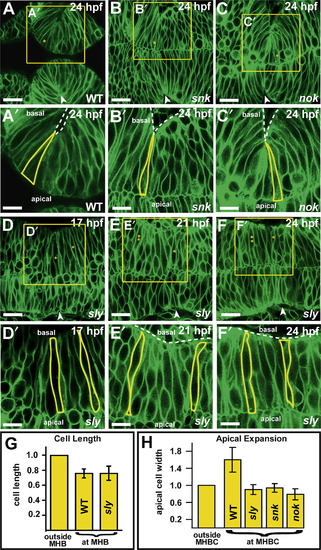
Basal constriction at the MHBC is laminin-dependent and not dependent on ventricle inflation. (A–C′) Live laser-confocal imaging of wild type, snk and nok embryos at 24 hpf after injection with memGFP. Boxed regions in (A–C) are enlarged in (A′–C′). Cells at the MHBC in (A–A′) wild type, (B–B′) snk and (C–C′) nok undergo basal constriction (see cell outlines). (D–F′) Imaging of sly mutants injected with memGFP mRNA at the one cell stage and imaged at 17, 21, and 24 hpf. Boxed regions in (D–F) are enlarged for (D′–F′). (D′) At 17 hpf, MHB and surrounding cells are similar in length (see outlined cells). (E′) At 21 hpf, cells at the MHB are shorter than those surrounding. One cell at and one cell outside the MHB are outlined in yellow. Some cells are visible outside the neural tube. (F″) At 24 hpf, cells at the MHBC fail to basally constrict. For (A–C) and (D–F) asterisks indicate the cell that is outlined in the image below. Cells with two asterisks are outside MHB. Arrowheads indicate the MHBC. Dotted lines delineate the outside of the neural tube. Some green fluorescence is visible within outlined cells since the plane of section contains the surface of the cell membrane. Anterior is to the left in all images. Scale bars: A–C = 22 μM, A′–C′ = 12 μM, D–F = 18 μM, D′–F′ = 9 μM. (G) Length of cells at the MHB relative to those outside the MHB in WT and sly mutants. At 21 hpf, cells at the MHB (at MHB) in sly mutants are 0.76 (± 0.094 s.d.) the length of those outside the MHB (outside MHB), as in WT embryos (WT data is the same as from Fig. 2) (n = 6 embryos, 2 cells at MHB, 3 cells outside MHB were measured per embryo). (H) Graph compares the apical width of cells outside MHBC to cells at MHBC in WT, sly, snk, and nok embryos at 24 hpf. Basally constricted cells at the MHBC do not apparently show corresponding apical expansion snk and nok (n = 3 embryos each mutant, 2 cells at MHBC, 3 cells outside MHBC were measured per embryo). Cells at the MHBC in sly mutants that have shortened, but are not constricted basally, are also not expanded apically (n = 6 embryos, 3 cells at MHBC, 4 cells outside MHBC were measured per embryo). PHENOTYPE:
|
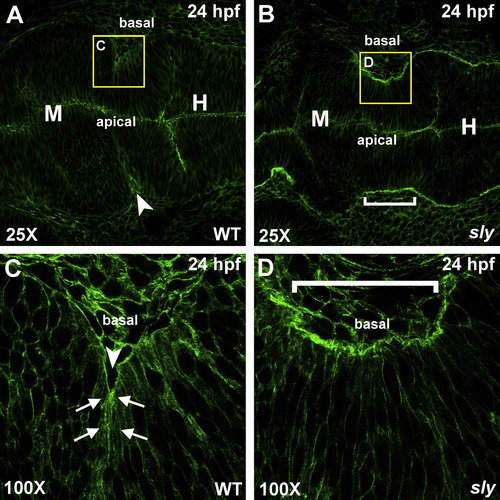
Actin is localized basally at the MHBC in wild type embryos. (A–D) Phalloidin stained wild type (A and C) and sly (B and D) embryos that were fixed at 24 hpf. Stained embryos were flat mounted in glycerol and imaged by confocal microscopy at 25X (A and B) and 100X (C and D). Arrows indicate points of basal actin accumulation in wild type embryos. Anterior is to the left in all images. Arrowhead indicates the MHBC in wild type and a bracket indicates the MHBC region in sly mutants. M, midbrain; H, hindbrain. PHENOTYPE:
|
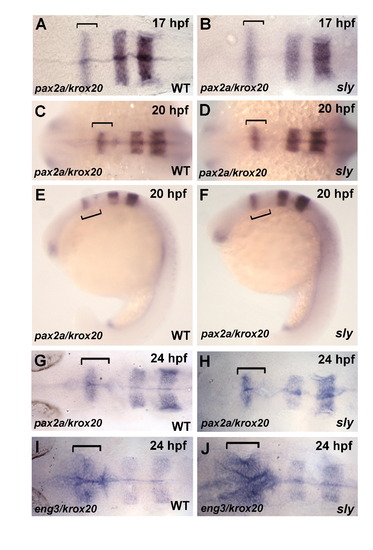
Patterning gene expression is normal in sly mutants during MHBC formation. (A–H) Wild type and sly mutants were analyzed by in situ hybridization for pax2a and krox20 at 17, 20, and 24 hpf. Gene expression at 17 hpf was normal in sly compared to wild type shown in (A and B). At 20 hpf gene expression remained normal, shown dorsally (C and D) and laterally (E and F). At 24 hpf pax2a and krox20 are still expressed normally in sly mutants compared to wild type (G and H). (I–J) Wild type and sly mutants were analyzed for expression of engrailed 3 (eng3) and krox20 at 24 hpf. In sly mutants, the eng3 expression domain appeared to be extended along the neural tube around the MHB relative to wild type. This is because the MHB tissue in the mutant is also elongated due to the lack of a sharp MHBC and MHB fold, indicating that gene expression in the MHB at the time of MHBC formation is the same in wild type embryos and in sly mutants. The bracket marks the MHB region in each embryo. Anterior is to the left in all images. EXPRESSION / LABELING:
|
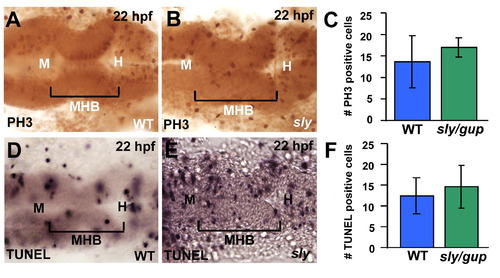
Levels of proliferation and cell death in laminin mutants are normal. (A–C) Wild type and laminin mutant embryos were fixed and stained with PH3 antibody as a marker for cell proliferation at 22 hpf and the cells in the MHB were counted and compared between wild type and laminin mutants. Representative images of PH3 stained wild type and sly embryos are seen in (A and B), respectively. Quantitation of PH3 positive cells indicated that there was no difference in the number of positive cells in the MHB of laminin mutants compared to wild type controls (C). (n = 3 control, n = 5 laminin mutants; 3 sly, 2 gup) (D–E) Wild type and laminin mutants were assayed by TUNEL to determine amount of apoptosis at 22 hpf. Cells in the MHB were counted and compared between wild type and laminin mutants. Representative images of TUNEL stained wild type and sly mutants are seen in (D and E), respectively. Differences in refractility between (D and E) are due to microscope settings. Quantitation of TUNEL positive cells in the MHB of laminin mutants compared to wild type controls indicated that there was no difference in the number of positive cells (F). (n = 7 control, n = 5 laminin mutants, 3 sly, 2 gup). Anterior is to the left in all images. M, midbrain; H, hindbrain. PHENOTYPE:
|
Reprinted from Mechanisms of Development, 125(11-12), Gutzman, J.H., Graeden, E.G., Lowery, L.A., Holley, H.S., and Sive, H., Formation of the zebrafish midbrain-hindbrain boundary constriction requires laminin-dependent basal constriction, 974-983, Copyright (2008) with permission from Elsevier. Full text @ Mech. Dev.