
Figure 2.
- ID
- ZDB-IMAGE-260509-13
- Genes
- Publication
- Gillotay et al., 2026 - The role of Nrf2 in thyroid maturation and hormone synthesis in vertebrate models
- All Figures
- Figures for Gillotay et al., 2026
|
Figure 2.
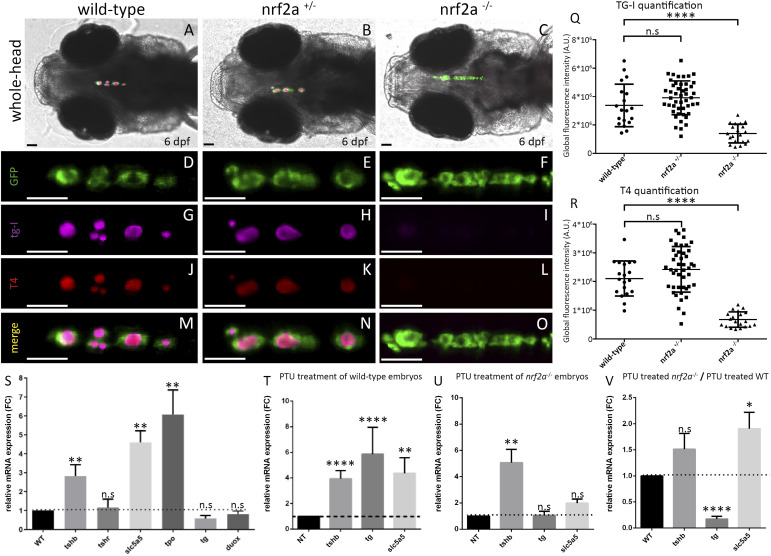
Loss-of-function of nrf2a induces thyroid dyshormonogenesis.
(A, B, C, D, E, F, G, H, I, J, K, L, M, N, O) Immunofluorescence on 6 dpf Tg(tg:nlsEGFP) zebrafish embryos targeting GFP, thyroxine (T4-Cy3, red), and iodinated thyroglobulin (TG-I–Cy5, magenta) reveals a defect in thyroid hormone production in nrf2a homozygous mutant compared with their WT and heterozygous mutant siblings. (A, B, C) show whole head pictures of representative embryos of each genotype (ventral view, anterior to the left). (D, E, F, G, H, I, J, K, L, M, N, O) Enlarged thyroid views of the corresponding embryos demonstrated thyroid follicular organization in all embryos (D, E, F); however, an absence of TG-I and T4 was observed only in nrf2a−/− embryos (F, I, L, O). (Q, R) Quantification of iodinated thyroglobulin (Q) and colloidal thyroxine (R) immunofluorescence signal in individual WT (n = 19), heterozygous (n = 45), and homozygous mutant embryos (n = 20) reveals a significant reduction in the nrf2a−/− group. Results are shown as the mean ± SD. The asterisk denotes significant differences between groups of embryos (****P < 0.0001, one-way ANOVA multiple comparison test). Scale bars (A, B, C, D, E, F, G, H, I, J, K, L, M, N, O): 50 μm. (S) Quantitative analysis of thyroid marker expression levels by qRT-PCR in 6 dpf embryos revealed no differential expression of tshr (P = 0.7706) and a slight, nonsignificant reduction of tg (P = 0.1775) and duox (P = 0.1) in nrf2a homozygous mutant embryos compared with WT siblings. In contrast, mRNA levels of tshβ (P < 0.01), slc5a5 (P < 0.01), and tpo (P < 0.01) were significantly increased in nrf2a mutant embryos, indicating elevated basal expression of thyroid function–related genes. (T, U) Quantitative analysis of thyroid marker expression in 6 dpf WT and nrf2a−/− embryos after PTU treatment compared with their respective nontreated (NT) controls. In WT embryos, PTU treatment induced a strong increase in tshβ (****P < 0.0001), tg (****P < 0.0001), and slc5a5 (P < 0.01). In nrf2a−/− embryos, PTU treatment significantly increased tshβ expression (**P < 0.01), whereas tg (P > 0.9999) and slc5a5 (P = 0.2499) expression did not significantly change relative to their NT controls. These panels represent within-genotype fold-change responses to PTU treatment, normalized to each genotype’s own baseline expression level. (V) Direct comparison of thyroid marker expression between PTU-treated WT and PTU-treated nrf2a−/− embryos. In this panel, expression levels are compared between genotypes under the same treatment condition, rather than relative to each genotype’s baseline. Quantitative analysis showed that tshβ expression does not significantly differ between PTU-treated nrf2a−/− embryos and their WT siblings (P > 0.9999). However, nrf2a−/− embryos fail to up-regulate tg upon PTU treatment compared with WT (****P < 0.0001), whereas slc5a5 expression remains significantly higher in PTU-treated nrf2a−/− embryos (P = 0.0183). All qRT-PCR data represent relative gene expression normalized to the indicated control group (nontreated [NT] or WT, shown as the black column). The dashed black line indicates the control expression level to facilitate visual comparison across conditions. Data are presented as the mean ± SD. Statistical significance was determined using the Kruskal–Wallis test with multiple comparisons. The asterisk denotes significant differences between groups (*P < 0.05, **P < 0.01, ****P < 0.0001). “n.s.” denotes no significant difference. N varies between 5 and 6 independent pools of 10 embryos per gene.