
|
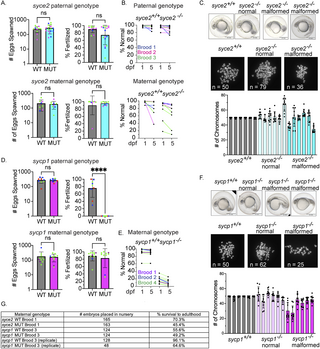
Fig. 4 syce2-/- and sycp1-/- mutants have different reproductive outcomes. (A) Number of eggs spawned and fertilization rate per cross from wild-type and syce2-/- mutants; paternal genotype (top) and maternal genotype (bottom). Each data point represents a cross yielding > 20 eggs from individual animals from three different broods born on different days. Percent fertilized excludes decomposed eggs. Each dot represents an individual animal crossed to AB wild-type fish of the opposite sex. syce2 paternal genotype: Brood 1 (S4461; blue): WT n = 3, MUT n = 6; Brood 2 (S4562, pink): WT n = 2; MUT n = 5; Brood 3 (S4581; green): WT n = 6, MUT n = 6. syce2 maternal genotype: Brood 1 (S4461; blue): WT n = 2, MUT n = 1; Brood 2 (S4562, pink): WT n = 2; MUT n = 2; Brood 3 (S4581; green): WT n = 4, MUT n = 5. Significance was determined using an unpaired t-test for pooled data. ns = not significant. (B) Percent Normal-looking offspring at 1- and 5-days post fertilization (dpf) from wild-type and syce2 mutants from data in (A). Progeny from the syce2 paternal genotype (top) and progeny from the syce2 maternal genotype (bottom). Colored lines represent animals from 3 broods shown as colors in part A. (C) Examples of embryonic progeny of syce2+/+ mothers and normal-looking and malformed embryos from syce2-/- mothers (top). Examples of metaphase chromosome spreads from embryonic cells stained with DAPI isolated from embryos from syce2+/+ mothers and normal-looking and malformed embryos from syce2-/- mothers. The number of chromosomes in the spread is provided as n. Note, the embryos and spreads are independent and are not matched by animal. Quantification of the chromosome content in individual normal-looking (MUT-N) and malformed (MUT-D) offspring. Each column represents an individual embryo; dots represent the number of chromosomes in ten nuclei per embryo. Scale bar = 0.5 mm. (D) Number of eggs spawned and fertilization rate per cross for wild-type and sycp1-/- mutants; paternal genotype (top) and maternal genotype (bottom). Analysis was performed as described in (A). sycp1 paternal genotype includes Broods 2, 3, and 4. Brood 2 (S4297; blue): WT n = 4, MUT n = 3; Brood 3 (S4347; red): WT n = 3; MUT n = 2; Brood 4 (S44434; green): WT n = 2, MUT n = 4.The sycp1 maternal genotype includes Broods 1, 2, and 4. Brood 1 (S3667; purple): WT n = 2, MUT n = 1; Brood 2 (S4297; blue): WT n = 1; MUT n = 1; Brood 4 (S44434; green): WT n = 8, MUT n = 8. Significance was determined using an unpaired t-test for pooled data. ns = not significant.; **** = p < 0.0001. (E) Percent Normal-looking offspring at 1- and 5-days post fertilization (dpf) from wild-type and sycp1 maternal genotype. Colored lines represent animals from 3 broods in part D. (F) Analysis as in part C for progeny of sycp1+/+ and sycp1-/- mothers. (G) Table showing a subset of embryos placed in the nursery from select broods and the percent that survived to adulthood.