
|
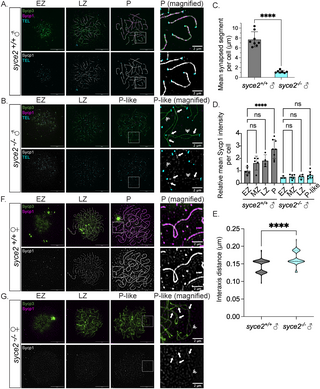
Fig. 2 Loss of Syce2 function results in asynapsed interstitial regions. (A–B) Surface-spread chromosomes from syce2+/+ (A) and syce2-/- (B) spermatocytes imaged using structured illumination microscopy. Proteins are immunostained for Sycp3 (green) and Sycp1 (magenta and gray). Telomeres (cyan) are detected by in-situ hybridization using a fluorescent PNA probe. Examples of spread chromosomes during meiotic prophase I are shown: Early Zygotene (EZ), Late Zygotene (LZ), Pachytene (P) (syce2+/+), and Pachytene-like (P-like) (syce2-/-). Scale bar = 10 µm. Boxed region represents magnified examples of synapsed pachytene (syce2+/+) and pachytene-like (syce2-/-) chromosomes. Scale bar for magnified examples = 2 µm. Arrows represent synapsed-like regions with Sycp1 localization. Double arrowheads indicate Sycp1 localization at unaligned axial regions. (C) Mean synapsed segment per cell (µm) in pachytene and pachytene-like spermatocytes. The mean synapsed segment is significantly lower in syce2-/- spermatocytes (n = 7) compared to syce2+/+ (n = 8). Significance was determined using an unpaired t-test. **** = p < 0.0001. (D) Relative mean Sycp1 intensity per cell from early zygotene to pachytene or pachytene-like spermatocytes normalized to the mean syce2+/+ EZ values. Mean-fluorescence intensity between the axes (n = 25) – mean background (n = 6) was determined for each cell using the segmented-line tool in ImageJ. n = 5, syce2+/+ – EZ; n = 5; syce2+/+ – MZ; n = 4, syce2+/+ – LZ; n = 8, syce2+/+ – P; n = 3, syce2-/- – EZ; n = 6, syce2-/- – MZ; n = 4, syce2-/- – LZ; n = 7, syce2-/- – P-like. Significance was determined using ordinary one-way ANOVA testing with Šidák’s multiple comparisons test. ns = not significant; **** = p < 0.0001. (E) Distance between axes for co-aligned axial pairs in pachytene (n = 126) and pachytene-like (n = 93) spermatocytes from 8 cells in syce2+/+ and 7 cells in syce2-/- shown as a violin plot. Note that one pixel is equal to 0.03 µm resulting in a graph with a bimodal distribution. Significance was determined using an unpaired t-test. **** = p < 0.0001. (F–G) Surface-spread chromosomes from syce2+/+ (F) and syce2-/- (G) oocytes imaged using structured illumination microscopy immunostained for Sycp3 and Sycp1. Examples of spread chromosomes during meiotic prophase I are described in (A–B). Scale bar = 10 µm. Boxed region represents magnified examples of synapsed pachytene and pachytene-like chromosomes. Scale bar for magnified examples = 2 µm. Arrows represent synapsed-like regions with Sycp1 localization. Double arrowhead indicates Sycp1 localization at unaligned axial regions.