
|
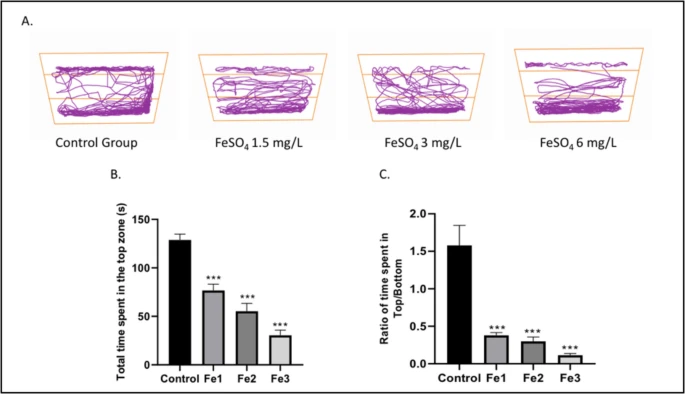
Fig. 3 Ferrous Sulphate (1.5, 3, and 6 mg/L) impaired the locomotion and increased the anxiety levels in the zebrafish when subjected to novel tank test (A) Illustration of representative locomotion tracking pattern (Novel tank test) of the Control group and FeSO4 (1.5, 3, and 6 mg/L) treated groups. (B) Graphical representation of the total time spent by the zebrafish in the top zone of the novel tank. (C) Graphical representation of the Ratio of time spent in the Top/Bottom zone in the different groups. Data are represented as means ± S.E.M. (n = 10). For Bonferroni’s post hoc analyses: (B) Control vs. Fe1(1.5 mg/L): *** p < 0.0001, Control vs. Fe2(3 mg/L): *** p < 0.0001, Control vs. Fe3(6 mg/L): *** p < 0.0001. (C) Control vs. Fe1(1.5 mg/L): *** p < 0.0001, Control vs. Fe2(3 mg/L): *** p < 0.0001, Control vs. Fe3(6 mg/L): *** p < 0.0001